|
Download Data (XLS File) |
|
|||||
|
|||||
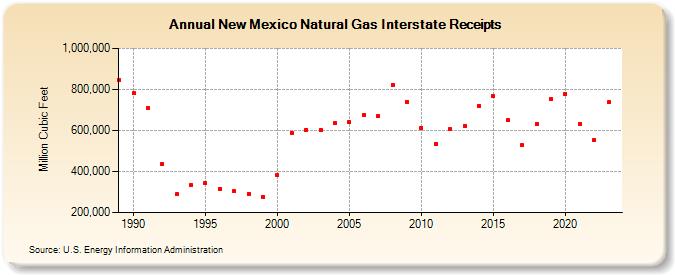
| New Mexico Natural Gas Interstate Receipts (Million Cubic Feet) | |||||
| Decade | Year-0 | Year-1 | Year-2 | Year-3 | Year-4 | Year-5 | Year-6 | Year-7 | Year-8 | Year-9 |
|---|---|---|---|---|---|---|---|---|---|---|
| 1980's | 846,451 | |||||||||
| 1990's | 780,741 | 707,737 | 436,787 | 289,001 | 334,650 | 343,196 | 316,153 | 303,455 | 292,297 | 276,296 |
| 2000's | 380,673 | 589,410 | 604,054 | 602,437 | 634,651 | 640,548 | 676,669 | 669,822 | 821,770 | 740,153 |
| 2010's | 613,482 | 535,450 | 606,062 | 622,930 | 719,559 | 766,409 | 649,110 | 527,216 | 631,002 | 753,621 |
| 2020's | 780,091 | 631,316 | 553,094 | 737,123 | 679,737 |
| - = No Data Reported; -- = Not Applicable; NA = Not Available; W = Withheld to avoid disclosure of individual company data. |
| Release Date: 6/30/2026 |
| Next Release Date: 7/31/2026 |