|
Download Data (XLS File) |
|
|||||
|
|||||
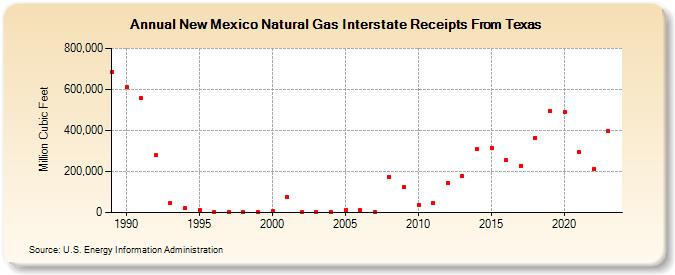
| New Mexico Natural Gas Interstate Receipts From Texas (Million Cubic Feet) | |||||
| Decade | Year-0 | Year-1 | Year-2 | Year-3 | Year-4 | Year-5 | Year-6 | Year-7 | Year-8 | Year-9 |
|---|---|---|---|---|---|---|---|---|---|---|
| 1980's | 686,270 | |||||||||
| 1990's | 610,717 | 557,716 | 278,127 | 47,934 | 20,235 | 10,771 | 4,089 | 4,966 | 4,470 | 5,104 |
| 2000's | 6,721 | 75,142 | 3,185 | 3,835 | 4,840 | 10,605 | 11,517 | 2,984 | 173,465 | 125,358 |
| 2010's | 36,848 | 44,156 | 143,779 | 177,728 | 308,856 | 316,749 | 256,374 | 228,558 | 365,722 | 497,056 |
| 2020's | 488,955 | 292,984 | 213,370 | 395,631 | 390,293 |
| - = No Data Reported; -- = Not Applicable; NA = Not Available; W = Withheld to avoid disclosure of individual company data. |
| Release Date: 6/30/2026 |
| Next Release Date: 7/31/2026 |