|
Download Data (XLS File) |
|
|||||
|
|||||
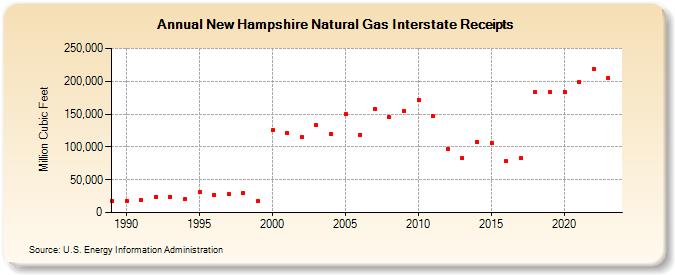
| New Hampshire Natural Gas Interstate Receipts (Million Cubic Feet) | |||||
| Decade | Year-0 | Year-1 | Year-2 | Year-3 | Year-4 | Year-5 | Year-6 | Year-7 | Year-8 | Year-9 |
|---|---|---|---|---|---|---|---|---|---|---|
| 1980's | 17,736 | |||||||||
| 1990's | 18,090 | 19,494 | 24,110 | 24,232 | 20,249 | 31,742 | 27,435 | 27,720 | 30,093 | 17,073 |
| 2000's | 125,384 | 120,784 | 115,367 | 132,767 | 119,970 | 149,989 | 118,310 | 157,776 | 144,808 | 154,649 |
| 2010's | 172,007 | 146,961 | 97,267 | 83,074 | 107,488 | 106,024 | 78,360 | 82,757 | 183,361 | 183,726 |
| 2020's | 184,136 | 198,973 | 218,925 | 205,201 | 239,644 |
| - = No Data Reported; -- = Not Applicable; NA = Not Available; W = Withheld to avoid disclosure of individual company data. |
| Release Date: 6/30/2026 |
| Next Release Date: 7/31/2026 |