|
Download Data (XLS File) |
|
|||||
|
|||||
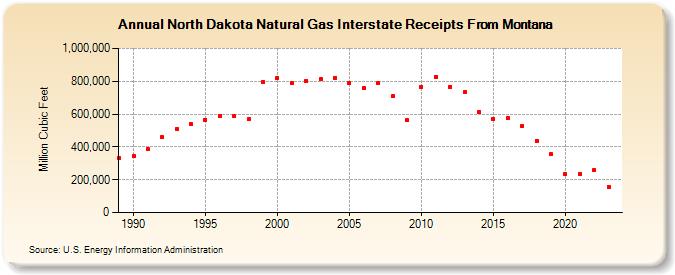
| North Dakota Natural Gas Interstate Receipts From Montana (Million Cubic Feet) | |||||
| Decade | Year-0 | Year-1 | Year-2 | Year-3 | Year-4 | Year-5 | Year-6 | Year-7 | Year-8 | Year-9 |
|---|---|---|---|---|---|---|---|---|---|---|
| 1980's | 330,882 | |||||||||
| 1990's | 344,607 | 386,058 | 457,706 | 511,805 | 537,121 | 566,583 | 589,887 | 586,353 | 567,489 | 796,331 |
| 2000's | 820,411 | 786,451 | 804,253 | 812,741 | 821,629 | 786,922 | 757,734 | 789,003 | 708,438 | 561,433 |
| 2010's | 767,263 | 827,585 | 767,651 | 733,992 | 614,893 | 572,007 | 575,971 | 528,086 | 438,611 | 353,915 |
| 2020's | 233,244 | 236,865 | 257,874 | 158,111 | 153,298 |
| - = No Data Reported; -- = Not Applicable; NA = Not Available; W = Withheld to avoid disclosure of individual company data. |
| Release Date: 6/30/2026 |
| Next Release Date: 7/31/2026 |