|
Download Data (XLS File) |
|
|||||
|
|||||
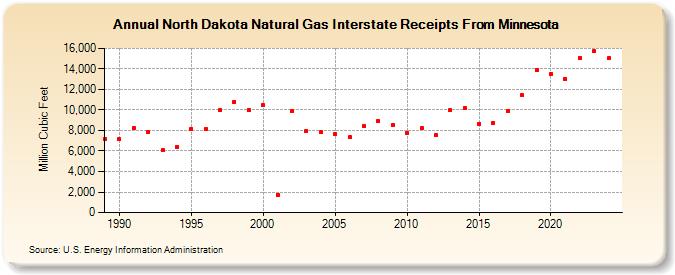
| North Dakota Natural Gas Interstate Receipts From Minnesota (Million Cubic Feet) | |||||
| Decade | Year-0 | Year-1 | Year-2 | Year-3 | Year-4 | Year-5 | Year-6 | Year-7 | Year-8 | Year-9 |
|---|---|---|---|---|---|---|---|---|---|---|
| 1980's | 7,190 | |||||||||
| 1990's | 7,135 | 8,261 | 7,886 | 6,092 | 6,422 | 8,184 | 8,157 | 9,984 | 10,796 | 9,988 |
| 2000's | 10,467 | 1,742 | 9,880 | 7,901 | 7,815 | 7,680 | 7,320 | 8,400 | 8,875 | 8,503 |
| 2010's | 7,773 | 8,213 | 7,540 | 9,956 | 10,176 | 8,668 | 8,757 | 9,907 | 11,409 | 13,900 |
| 2020's | 13,526 | 13,053 | 15,071 | 15,739 | 15,023 |
| - = No Data Reported; -- = Not Applicable; NA = Not Available; W = Withheld to avoid disclosure of individual company data. |
| Release Date: 6/30/2026 |
| Next Release Date: 7/31/2026 |