|
Download Data (XLS File) |
|
|||||
|
|||||
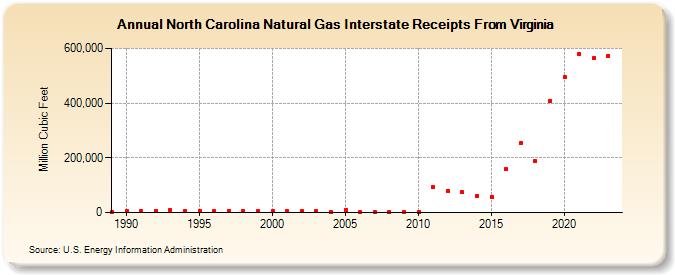
| North Carolina Natural Gas Interstate Receipts From Virginia (Million Cubic Feet) | |||||
| Decade | Year-0 | Year-1 | Year-2 | Year-3 | Year-4 | Year-5 | Year-6 | Year-7 | Year-8 | Year-9 |
|---|---|---|---|---|---|---|---|---|---|---|
| 1980's | 1,820 | |||||||||
| 1990's | 4,743 | 4,585 | 6,637 | 8,734 | 5,115 | 7,376 | 5,446 | 5,276 | 5,019 | 4,667 |
| 2000's | 5,101 | 4,915 | 4,986 | 4,769 | 2,975 | 10,878 | 755 | 1,354 | 1,326 | 2,688 |
| 2010's | 1,959 | 93,698 | 78,807 | 74,103 | 61,211 | 57,114 | 158,917 | 253,263 | 186,821 | 408,868 |
| 2020's | 495,854 | 579,065 | 564,321 | 572,343 | 588,591 |
| - = No Data Reported; -- = Not Applicable; NA = Not Available; W = Withheld to avoid disclosure of individual company data. |
| Release Date: 6/30/2026 |
| Next Release Date: 7/31/2026 |