|
Download Data (XLS File) |
|
|||||
|
|||||
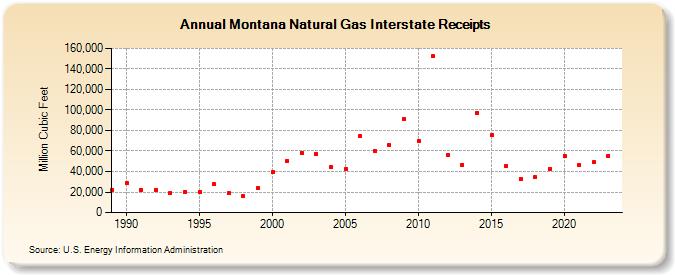
| Montana Natural Gas Interstate Receipts (Million Cubic Feet) | |||||
| Decade | Year-0 | Year-1 | Year-2 | Year-3 | Year-4 | Year-5 | Year-6 | Year-7 | Year-8 | Year-9 |
|---|---|---|---|---|---|---|---|---|---|---|
| 1980's | 22,259 | |||||||||
| 1990's | 28,628 | 22,128 | 21,791 | 19,293 | 20,408 | 20,207 | 27,448 | 19,054 | 16,410 | 23,871 |
| 2000's | 39,386 | 50,636 | 58,402 | 56,851 | 44,045 | 42,461 | 74,544 | 60,056 | 65,804 | 90,988 |
| 2010's | 69,777 | 152,147 | 55,965 | 46,404 | 97,254 | 75,789 | 45,727 | 33,189 | 34,547 | 42,728 |
| 2020's | 55,267 | 46,121 | 48,980 | 55,522 | 79,481 |
| - = No Data Reported; -- = Not Applicable; NA = Not Available; W = Withheld to avoid disclosure of individual company data. |
| Release Date: 6/30/2026 |
| Next Release Date: 7/31/2026 |