|
Download Data (XLS File) |
|
|||||
|
|||||
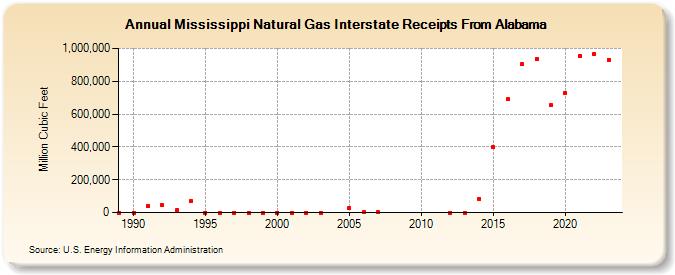
| Mississippi Natural Gas Interstate Receipts From Alabama (Million Cubic Feet) | |||||
| Decade | Year-0 | Year-1 | Year-2 | Year-3 | Year-4 | Year-5 | Year-6 | Year-7 | Year-8 | Year-9 |
|---|---|---|---|---|---|---|---|---|---|---|
| 1980's | 0 | |||||||||
| 1990's | 0 | 40,000 | 45,000 | 13,790 | 70,961 | 0 | 0 | 0 | 0 | 0 |
| 2000's | 2 | 0 | 0 | 0 | 29,191 | 628 | 682 | |||
| 2010's | 0 | 5 | 84,847 | 397,676 | 689,466 | 902,510 | 934,065 | 652,444 | ||
| 2020's | 728,785 | 953,724 | 965,241 | 931,899 | 925,017 |
| - = No Data Reported; -- = Not Applicable; NA = Not Available; W = Withheld to avoid disclosure of individual company data. |
| Release Date: 6/30/2026 |
| Next Release Date: 7/31/2026 |