|
Download Data (XLS File) |
|
|||||
|
|||||
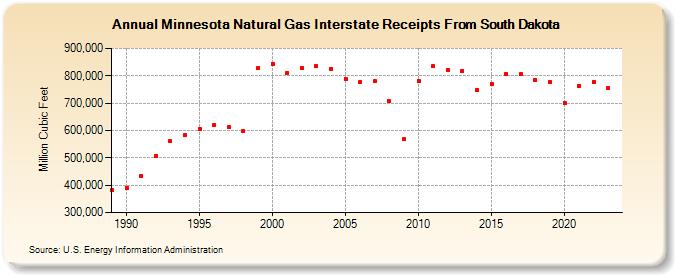
| Minnesota Natural Gas Interstate Receipts From South Dakota (Million Cubic Feet) | |||||
| Decade | Year-0 | Year-1 | Year-2 | Year-3 | Year-4 | Year-5 | Year-6 | Year-7 | Year-8 | Year-9 |
|---|---|---|---|---|---|---|---|---|---|---|
| 1980's | 381,264 | |||||||||
| 1990's | 390,307 | 432,789 | 505,390 | 560,910 | 583,312 | 603,574 | 619,703 | 611,095 | 598,004 | 826,638 |
| 2000's | 843,913 | 811,585 | 828,492 | 834,664 | 826,279 | 789,762 | 777,976 | 779,241 | 706,380 | 567,050 |
| 2010's | 780,640 | 834,224 | 821,780 | 817,384 | 748,376 | 770,432 | 805,990 | 805,918 | 784,169 | 778,050 |
| 2020's | 700,091 | 761,856 | 778,337 | 753,985 | 773,620 |
| - = No Data Reported; -- = Not Applicable; NA = Not Available; W = Withheld to avoid disclosure of individual company data. |
| Release Date: 6/30/2026 |
| Next Release Date: 7/31/2026 |