|
Download Data (XLS File) |
|
|||||
|
|||||
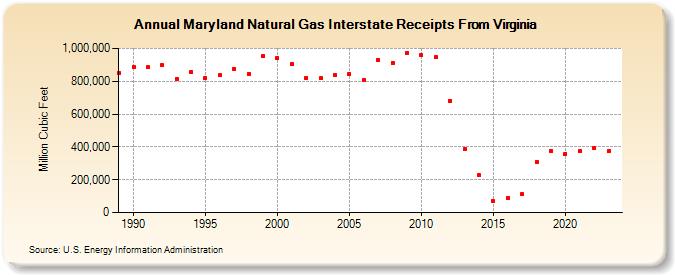
| Maryland Natural Gas Interstate Receipts From Virginia (Million Cubic Feet) | |||||
| Decade | Year-0 | Year-1 | Year-2 | Year-3 | Year-4 | Year-5 | Year-6 | Year-7 | Year-8 | Year-9 |
|---|---|---|---|---|---|---|---|---|---|---|
| 1980's | 850,327 | |||||||||
| 1990's | 887,497 | 885,087 | 896,839 | 815,566 | 856,866 | 819,981 | 835,664 | 874,829 | 845,244 | 953,660 |
| 2000's | 940,124 | 903,384 | 820,240 | 817,163 | 837,112 | 844,624 | 806,889 | 931,416 | 913,699 | 974,632 |
| 2010's | 956,709 | 945,284 | 681,694 | 386,898 | 225,932 | 67,753 | 88,750 | 111,028 | 308,281 | 375,627 |
| 2020's | 358,390 | 375,957 | 394,620 | 373,989 | 403,280 |
| - = No Data Reported; -- = Not Applicable; NA = Not Available; W = Withheld to avoid disclosure of individual company data. |
| Release Date: 6/30/2026 |
| Next Release Date: 7/31/2026 |