|
Download Data (XLS File) |
|
|||||
|
|||||
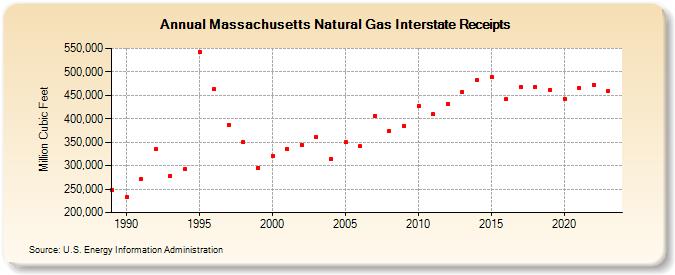
| Massachusetts Natural Gas Interstate Receipts (Million Cubic Feet) | |||||
| Decade | Year-0 | Year-1 | Year-2 | Year-3 | Year-4 | Year-5 | Year-6 | Year-7 | Year-8 | Year-9 |
|---|---|---|---|---|---|---|---|---|---|---|
| 1980's | 248,715 | |||||||||
| 1990's | 232,459 | 272,029 | 334,816 | 278,925 | 292,161 | 541,527 | 462,643 | 387,349 | 350,148 | 295,928 |
| 2000's | 321,352 | 335,522 | 344,588 | 361,569 | 313,795 | 349,470 | 341,301 | 406,803 | 374,194 | 384,895 |
| 2010's | 427,208 | 409,352 | 431,454 | 457,483 | 483,629 | 488,977 | 441,055 | 467,958 | 468,191 | 462,219 |
| 2020's | 442,147 | 466,291 | 472,496 | 458,853 | 476,920 |
| - = No Data Reported; -- = Not Applicable; NA = Not Available; W = Withheld to avoid disclosure of individual company data. |
| Release Date: 6/30/2026 |
| Next Release Date: 7/31/2026 |