|
Download Data (XLS File) |
|
|||||
|
|||||
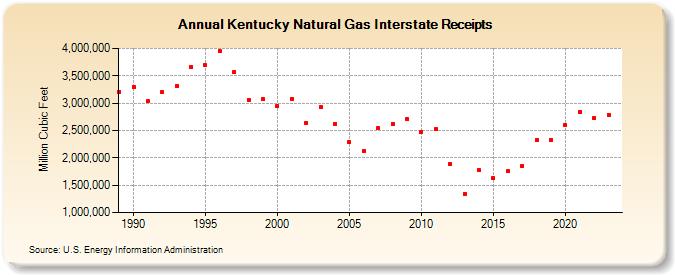
| Kentucky Natural Gas Interstate Receipts (Million Cubic Feet) | |||||
| Decade | Year-0 | Year-1 | Year-2 | Year-3 | Year-4 | Year-5 | Year-6 | Year-7 | Year-8 | Year-9 |
|---|---|---|---|---|---|---|---|---|---|---|
| 1980's | 3,208,031 | |||||||||
| 1990's | 3,303,547 | 3,030,350 | 3,197,882 | 3,314,559 | 3,663,838 | 3,689,277 | 3,956,093 | 3,576,553 | 3,062,969 | 3,072,091 |
| 2000's | 2,948,301 | 3,083,410 | 2,643,731 | 2,920,413 | 2,620,866 | 2,283,558 | 2,126,203 | 2,539,400 | 2,619,630 | 2,706,523 |
| 2010's | 2,472,489 | 2,524,935 | 1,889,878 | 1,346,012 | 1,774,475 | 1,630,513 | 1,754,687 | 1,853,849 | 2,325,783 | 2,327,432 |
| 2020's | 2,599,862 | 2,842,476 | 2,725,449 | 2,791,330 | 2,703,483 |
| - = No Data Reported; -- = Not Applicable; NA = Not Available; W = Withheld to avoid disclosure of individual company data. |
| Release Date: 6/30/2026 |
| Next Release Date: 7/31/2026 |