|
Download Data (XLS File) |
|
|||||
|
|||||
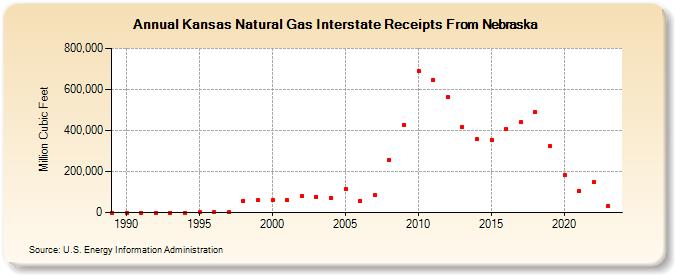
| Kansas Natural Gas Interstate Receipts From Nebraska (Million Cubic Feet) | |||||
| Decade | Year-0 | Year-1 | Year-2 | Year-3 | Year-4 | Year-5 | Year-6 | Year-7 | Year-8 | Year-9 |
|---|---|---|---|---|---|---|---|---|---|---|
| 1980's | 37 | |||||||||
| 1990's | 118 | 240 | 2 | 145 | 284 | 1,156 | 1,283 | 1,400 | 58,670 | 60,663 |
| 2000's | 60,663 | 60,663 | 80,412 | 77,837 | 72,412 | 115,323 | 58,372 | 84,063 | 257,451 | 428,090 |
| 2010's | 690,808 | 647,169 | 561,430 | 416,921 | 356,253 | 355,115 | 407,779 | 439,475 | 490,349 | 324,266 |
| 2020's | 182,268 | 105,888 | 148,629 | 31,627 | 146,581 |
| - = No Data Reported; -- = Not Applicable; NA = Not Available; W = Withheld to avoid disclosure of individual company data. |
| Release Date: 6/30/2026 |
| Next Release Date: 7/31/2026 |