|
Download Data (XLS File) |
|
|||||
|
|||||
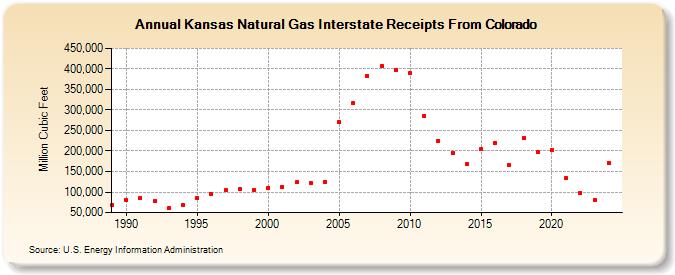
| Kansas Natural Gas Interstate Receipts From Colorado (Million Cubic Feet) | |||||
| Decade | Year-0 | Year-1 | Year-2 | Year-3 | Year-4 | Year-5 | Year-6 | Year-7 | Year-8 | Year-9 |
|---|---|---|---|---|---|---|---|---|---|---|
| 1980's | 67,512 | |||||||||
| 1990's | 81,743 | 86,326 | 77,652 | 60,398 | 67,430 | 86,265 | 95,358 | 103,952 | 106,521 | 105,402 |
| 2000's | 110,787 | 113,314 | 123,728 | 122,838 | 125,227 | 270,580 | 315,739 | 382,675 | 406,697 | 398,033 |
| 2010's | 389,330 | 285,435 | 224,515 | 195,633 | 167,119 | 203,797 | 220,079 | 164,794 | 231,941 | 197,514 |
| 2020's | 203,175 | 134,392 | 98,726 | 81,798 | 171,882 |
| - = No Data Reported; -- = Not Applicable; NA = Not Available; W = Withheld to avoid disclosure of individual company data. |
| Release Date: 6/30/2026 |
| Next Release Date: 7/31/2026 |