|
Download Data (XLS File) |
|
|||||
|
|||||
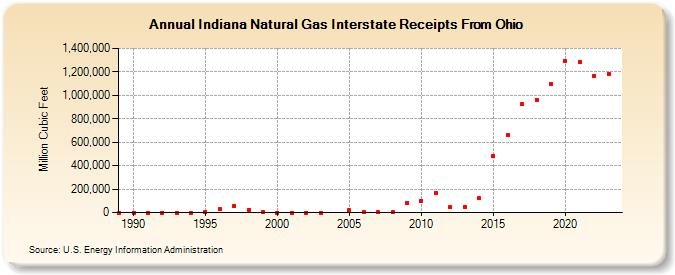
| Indiana Natural Gas Interstate Receipts From Ohio (Million Cubic Feet) | |||||
| Decade | Year-0 | Year-1 | Year-2 | Year-3 | Year-4 | Year-5 | Year-6 | Year-7 | Year-8 | Year-9 |
|---|---|---|---|---|---|---|---|---|---|---|
| 1980's | 0 | |||||||||
| 1990's | 0 | 0 | 0 | 0 | 0 | 7,339 | 27,609 | 53,819 | 22,938 | 8,486 |
| 2000's | 0 | 0 | 0 | 0 | 18,125 | 3,953 | 783 | 1,316 | 83,766 | |
| 2010's | 102,687 | 170,205 | 45,633 | 51,546 | 122,004 | 483,035 | 659,558 | 927,044 | 963,742 | 1,095,513 |
| 2020's | 1,292,600 | 1,286,128 | 1,168,590 | 1,185,416 | 1,139,737 |
| - = No Data Reported; -- = Not Applicable; NA = Not Available; W = Withheld to avoid disclosure of individual company data. |
| Release Date: 6/30/2026 |
| Next Release Date: 7/31/2026 |