|
Download Data (XLS File) |
|
|||||
|
|||||
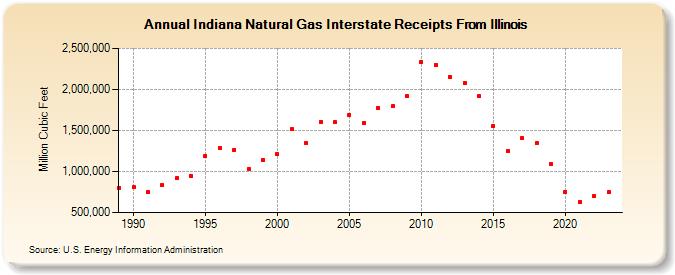
| Indiana Natural Gas Interstate Receipts From Illinois (Million Cubic Feet) | |||||
| Decade | Year-0 | Year-1 | Year-2 | Year-3 | Year-4 | Year-5 | Year-6 | Year-7 | Year-8 | Year-9 |
|---|---|---|---|---|---|---|---|---|---|---|
| 1980's | 801,277 | |||||||||
| 1990's | 808,079 | 748,673 | 836,916 | 918,628 | 949,056 | 1,191,927 | 1,289,309 | 1,266,782 | 1,030,674 | 1,144,055 |
| 2000's | 1,207,453 | 1,515,634 | 1,350,397 | 1,605,583 | 1,598,300 | 1,688,119 | 1,595,122 | 1,778,043 | 1,794,569 | 1,919,425 |
| 2010's | 2,334,400 | 2,303,047 | 2,153,489 | 2,075,780 | 1,919,958 | 1,556,742 | 1,250,362 | 1,408,398 | 1,346,706 | 1,091,019 |
| 2020's | 755,060 | 627,035 | 697,473 | 748,829 | 722,626 |
| - = No Data Reported; -- = Not Applicable; NA = Not Available; W = Withheld to avoid disclosure of individual company data. |
| Release Date: 6/30/2026 |
| Next Release Date: 7/31/2026 |