|
Download Data (XLS File) |
|
|||||
|
|||||
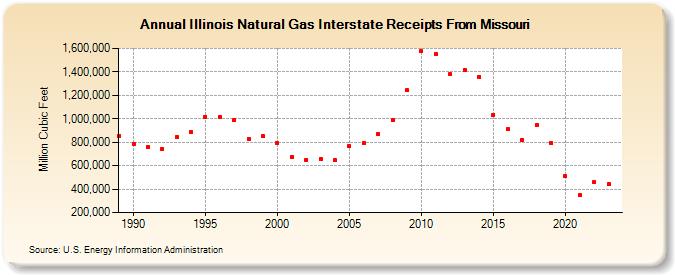
| Illinois Natural Gas Interstate Receipts From Missouri (Million Cubic Feet) | |||||
| Decade | Year-0 | Year-1 | Year-2 | Year-3 | Year-4 | Year-5 | Year-6 | Year-7 | Year-8 | Year-9 |
|---|---|---|---|---|---|---|---|---|---|---|
| 1980's | 855,181 | |||||||||
| 1990's | 786,634 | 762,899 | 742,981 | 845,081 | 886,398 | 1,016,356 | 1,015,520 | 987,980 | 831,469 | 850,653 |
| 2000's | 791,060 | 675,443 | 651,322 | 657,181 | 645,936 | 766,780 | 793,456 | 869,166 | 988,707 | 1,242,258 |
| 2010's | 1,576,550 | 1,555,320 | 1,378,922 | 1,413,699 | 1,359,364 | 1,034,716 | 910,606 | 819,462 | 945,191 | 792,620 |
| 2020's | 508,036 | 349,261 | 456,705 | 441,704 | 450,139 |
| - = No Data Reported; -- = Not Applicable; NA = Not Available; W = Withheld to avoid disclosure of individual company data. |
| Release Date: 6/30/2026 |
| Next Release Date: 7/31/2026 |