|
Download Data (XLS File) |
|
|||||
|
|||||
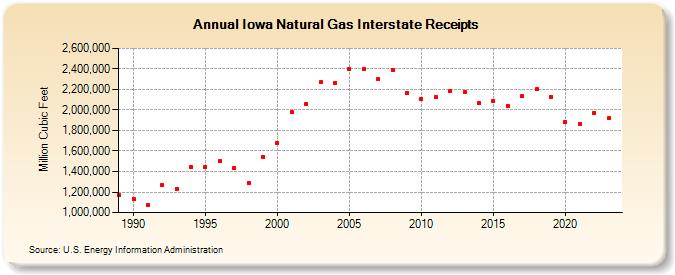
| Iowa Natural Gas Interstate Receipts (Million Cubic Feet) | |||||
| Decade | Year-0 | Year-1 | Year-2 | Year-3 | Year-4 | Year-5 | Year-6 | Year-7 | Year-8 | Year-9 |
|---|---|---|---|---|---|---|---|---|---|---|
| 1980's | 1,168,434 | |||||||||
| 1990's | 1,135,682 | 1,075,376 | 1,270,083 | 1,232,578 | 1,443,469 | 1,444,142 | 1,497,972 | 1,436,026 | 1,292,698 | 1,542,212 |
| 2000's | 1,682,214 | 1,978,500 | 2,058,965 | 2,270,272 | 2,263,390 | 2,401,549 | 2,400,356 | 2,297,174 | 2,391,697 | 2,163,049 |
| 2010's | 2,104,669 | 2,125,585 | 2,185,565 | 2,175,188 | 2,065,660 | 2,087,426 | 2,036,480 | 2,132,287 | 2,203,884 | 2,128,970 |
| 2020's | 1,883,122 | 1,861,267 | 1,972,784 | 1,918,542 | 1,997,596 |
| - = No Data Reported; -- = Not Applicable; NA = Not Available; W = Withheld to avoid disclosure of individual company data. |
| Release Date: 6/30/2026 |
| Next Release Date: 7/31/2026 |