|
Download Data (XLS File) |
|
|||||
|
|||||
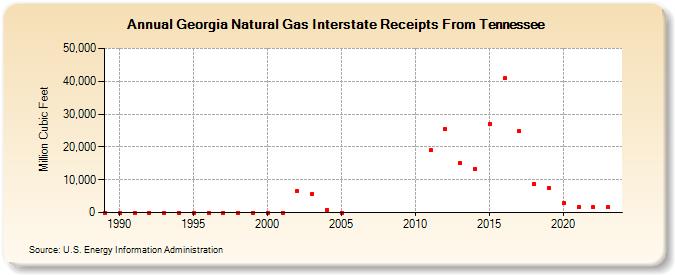
| Georgia Natural Gas Interstate Receipts From Tennessee (Million Cubic Feet) | |||||
| Decade | Year-0 | Year-1 | Year-2 | Year-3 | Year-4 | Year-5 | Year-6 | Year-7 | Year-8 | Year-9 |
|---|---|---|---|---|---|---|---|---|---|---|
| 1980's | 0 | |||||||||
| 1990's | 0 | 0 | 0 | 0 | 0 | 0 | 0 | 0 | 0 | 0 |
| 2000's | 0 | 0 | 6,530 | 5,785 | 884 | 0 | ||||
| 2010's | 18,934 | 25,337 | 15,142 | 13,305 | 27,099 | 40,833 | 24,749 | 8,811 | 7,548 | |
| 2020's | 2,817 | 1,668 | 1,688 | 1,557 | 1,608 |
| - = No Data Reported; -- = Not Applicable; NA = Not Available; W = Withheld to avoid disclosure of individual company data. |
| Release Date: 6/30/2026 |
| Next Release Date: 7/31/2026 |