|
Download Data (XLS File) |
|
|||||
|
|||||
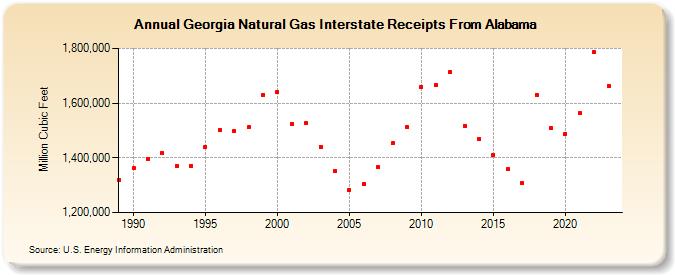
| Georgia Natural Gas Interstate Receipts From Alabama (Million Cubic Feet) | |||||
| Decade | Year-0 | Year-1 | Year-2 | Year-3 | Year-4 | Year-5 | Year-6 | Year-7 | Year-8 | Year-9 |
|---|---|---|---|---|---|---|---|---|---|---|
| 1980's | 1,320,609 | |||||||||
| 1990's | 1,361,415 | 1,397,050 | 1,418,312 | 1,371,442 | 1,371,651 | 1,439,907 | 1,502,968 | 1,498,880 | 1,511,671 | 1,631,329 |
| 2000's | 1,640,769 | 1,523,898 | 1,525,646 | 1,441,380 | 1,352,308 | 1,282,549 | 1,304,376 | 1,366,016 | 1,452,988 | 1,512,570 |
| 2010's | 1,660,068 | 1,665,731 | 1,714,216 | 1,517,217 | 1,470,014 | 1,411,839 | 1,358,360 | 1,308,619 | 1,631,303 | 1,509,630 |
| 2020's | 1,488,347 | 1,563,020 | 1,787,273 | 1,663,448 | 1,683,451 |
| - = No Data Reported; -- = Not Applicable; NA = Not Available; W = Withheld to avoid disclosure of individual company data. |
| Release Date: 6/30/2026 |
| Next Release Date: 7/31/2026 |