|
Download Data (XLS File) |
|
|||||
|
|||||
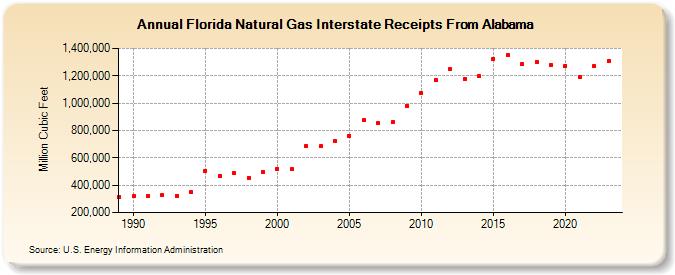
| Florida Natural Gas Interstate Receipts From Alabama (Million Cubic Feet) | |||||
| Decade | Year-0 | Year-1 | Year-2 | Year-3 | Year-4 | Year-5 | Year-6 | Year-7 | Year-8 | Year-9 |
|---|---|---|---|---|---|---|---|---|---|---|
| 1980's | 313,928 | |||||||||
| 1990's | 318,772 | 323,332 | 327,556 | 323,814 | 349,335 | 507,415 | 469,021 | 488,747 | 455,199 | 494,657 |
| 2000's | 520,856 | 516,441 | 685,261 | 682,935 | 722,558 | 762,976 | 875,877 | 854,505 | 860,513 | 981,561 |
| 2010's | 1,072,703 | 1,167,184 | 1,246,541 | 1,178,951 | 1,197,957 | 1,323,505 | 1,348,774 | 1,287,210 | 1,302,464 | 1,279,789 |
| 2020's | 1,273,138 | 1,190,968 | 1,268,398 | 1,307,639 | 1,356,359 |
| - = No Data Reported; -- = Not Applicable; NA = Not Available; W = Withheld to avoid disclosure of individual company data. |
| Release Date: 6/30/2026 |
| Next Release Date: 7/31/2026 |