|
Download Data (XLS File) |
|
|||||
|
|||||
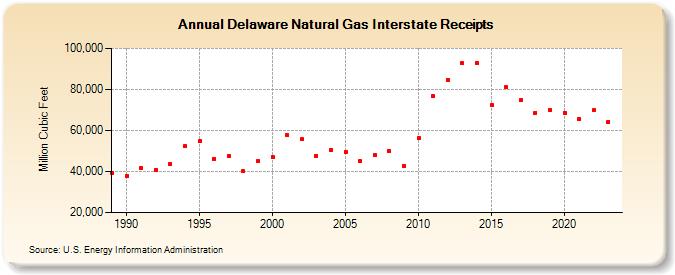
| Delaware Natural Gas Interstate Receipts (Million Cubic Feet) | |||||
| Decade | Year-0 | Year-1 | Year-2 | Year-3 | Year-4 | Year-5 | Year-6 | Year-7 | Year-8 | Year-9 |
|---|---|---|---|---|---|---|---|---|---|---|
| 1980's | 39,248 | |||||||||
| 1990's | 37,742 | 41,760 | 40,864 | 43,788 | 52,304 | 54,864 | 46,232 | 47,619 | 40,057 | 45,009 |
| 2000's | 47,052 | 57,771 | 55,660 | 47,731 | 50,453 | 49,725 | 44,970 | 47,917 | 49,964 | 42,862 |
| 2010's | 56,107 | 76,666 | 84,744 | 92,727 | 92,888 | 72,391 | 80,985 | 74,701 | 68,692 | 69,985 |
| 2020's | 68,691 | 65,623 | 69,843 | 64,342 | 62,664 |
| - = No Data Reported; -- = Not Applicable; NA = Not Available; W = Withheld to avoid disclosure of individual company data. |
| Release Date: 6/30/2026 |
| Next Release Date: 7/31/2026 |