|
Download Data (XLS File) |
|
|||||
|
|||||
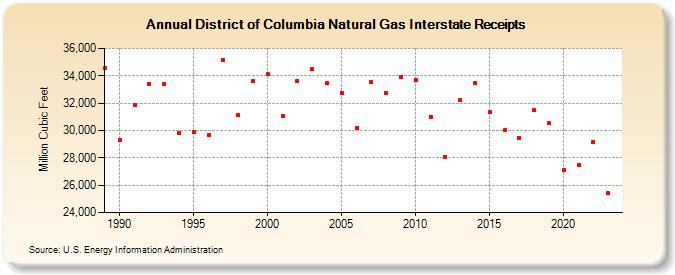
| District of Columbia Natural Gas Interstate Receipts (Million Cubic Feet) | |||||
| Decade | Year-0 | Year-1 | Year-2 | Year-3 | Year-4 | Year-5 | Year-6 | Year-7 | Year-8 | Year-9 |
|---|---|---|---|---|---|---|---|---|---|---|
| 1980's | 34,598 | |||||||||
| 1990's | 29,321 | 31,872 | 33,422 | 33,373 | 29,806 | 29,860 | 29,693 | 35,144 | 31,164 | 33,635 |
| 2000's | 34,120 | 31,068 | 33,647 | 34,467 | 33,472 | 32,727 | 30,216 | 33,565 | 32,723 | 33,928 |
| 2010's | 33,697 | 31,016 | 28,075 | 32,263 | 33,437 | 31,379 | 30,013 | 29,451 | 31,477 | 30,534 |
| 2020's | 27,090 | 27,458 | 29,182 | 25,398 | 26,268 |
| - = No Data Reported; -- = Not Applicable; NA = Not Available; W = Withheld to avoid disclosure of individual company data. |
| Release Date: 6/30/2026 |
| Next Release Date: 7/31/2026 |