|
Download Data (XLS File) |
|
|||||
|
|||||
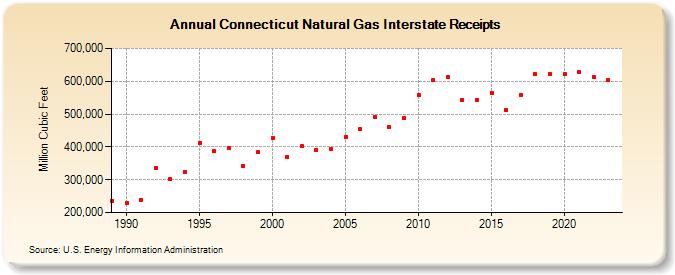
| Connecticut Natural Gas Interstate Receipts (Million Cubic Feet) | |||||
| Decade | Year-0 | Year-1 | Year-2 | Year-3 | Year-4 | Year-5 | Year-6 | Year-7 | Year-8 | Year-9 |
|---|---|---|---|---|---|---|---|---|---|---|
| 1980's | 234,593 | |||||||||
| 1990's | 227,723 | 239,690 | 336,972 | 302,126 | 324,576 | 410,639 | 388,927 | 396,610 | 342,482 | 383,598 |
| 2000's | 427,221 | 369,145 | 401,453 | 390,760 | 392,087 | 429,895 | 454,051 | 491,456 | 461,815 | 487,054 |
| 2010's | 558,082 | 602,876 | 612,920 | 543,700 | 541,355 | 564,179 | 512,510 | 558,581 | 620,501 | 622,173 |
| 2020's | 621,454 | 628,055 | 612,711 | 602,900 | 638,229 |
| - = No Data Reported; -- = Not Applicable; NA = Not Available; W = Withheld to avoid disclosure of individual company data. |
| Release Date: 6/30/2026 |
| Next Release Date: 7/31/2026 |