|
Download Data (XLS File) |
|
|||||
|
|||||
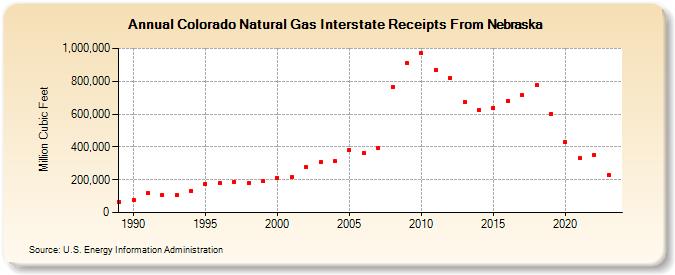
| Colorado Natural Gas Interstate Receipts From Nebraska (Million Cubic Feet) | |||||
| Decade | Year-0 | Year-1 | Year-2 | Year-3 | Year-4 | Year-5 | Year-6 | Year-7 | Year-8 | Year-9 |
|---|---|---|---|---|---|---|---|---|---|---|
| 1980's | 66,478 | |||||||||
| 1990's | 79,420 | 119,256 | 108,534 | 106,744 | 133,876 | 172,860 | 180,063 | 188,153 | 180,048 | 190,562 |
| 2000's | 212,117 | 215,297 | 275,942 | 307,263 | 311,712 | 381,654 | 363,067 | 395,845 | 767,615 | 909,547 |
| 2010's | 971,678 | 870,223 | 819,773 | 676,260 | 625,054 | 639,550 | 682,300 | 717,432 | 777,571 | 602,336 |
| 2020's | 429,323 | 330,196 | 352,596 | 229,470 | 378,460 |
| - = No Data Reported; -- = Not Applicable; NA = Not Available; W = Withheld to avoid disclosure of individual company data. |
| Release Date: 6/30/2026 |
| Next Release Date: 7/31/2026 |