|
Download Data (XLS File) |
|
|||||
|
|||||
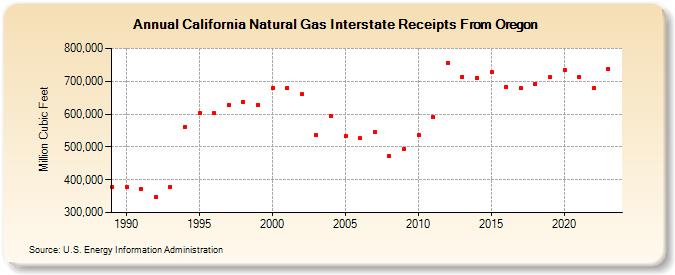
| California Natural Gas Interstate Receipts From Oregon (Million Cubic Feet) | |||||
| Decade | Year-0 | Year-1 | Year-2 | Year-3 | Year-4 | Year-5 | Year-6 | Year-7 | Year-8 | Year-9 |
|---|---|---|---|---|---|---|---|---|---|---|
| 1980's | 378,161 | |||||||||
| 1990's | 378,469 | 371,862 | 346,755 | 379,264 | 561,913 | 602,156 | 602,841 | 628,284 | 637,117 | 628,589 |
| 2000's | 678,453 | 680,368 | 659,944 | 536,776 | 592,855 | 531,868 | 526,726 | 544,638 | 473,430 | 494,000 |
| 2010's | 535,373 | 590,489 | 756,096 | 713,049 | 710,137 | 727,526 | 680,979 | 678,247 | 692,923 | 711,377 |
| 2020's | 734,597 | 712,853 | 679,507 | 738,530 | 686,167 |
| - = No Data Reported; -- = Not Applicable; NA = Not Available; W = Withheld to avoid disclosure of individual company data. |
| Release Date: 6/30/2026 |
| Next Release Date: 7/31/2026 |