|
Download Data (XLS File) |
|
|||||
|
|||||
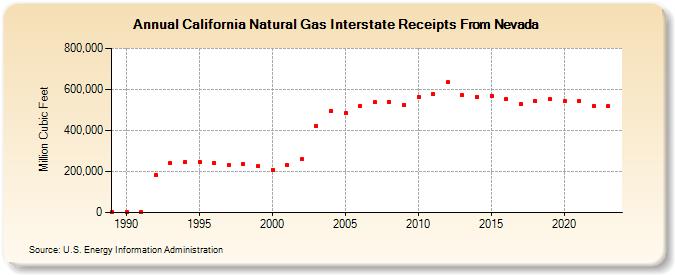
| California Natural Gas Interstate Receipts From Nevada (Million Cubic Feet) | |||||
| Decade | Year-0 | Year-1 | Year-2 | Year-3 | Year-4 | Year-5 | Year-6 | Year-7 | Year-8 | Year-9 |
|---|---|---|---|---|---|---|---|---|---|---|
| 1980's | 2,556 | |||||||||
| 1990's | 2,548 | 2,230 | 180,832 | 241,471 | 245,519 | 247,692 | 243,866 | 229,779 | 236,624 | 225,138 |
| 2000's | 209,242 | 229,845 | 259,753 | 423,897 | 494,660 | 483,554 | 520,062 | 537,518 | 539,545 | 525,398 |
| 2010's | 563,364 | 578,445 | 634,282 | 572,190 | 563,414 | 569,688 | 553,094 | 528,442 | 543,131 | 552,545 |
| 2020's | 542,021 | 542,610 | 519,463 | 518,117 | 458,589 |
| - = No Data Reported; -- = Not Applicable; NA = Not Available; W = Withheld to avoid disclosure of individual company data. |
| Release Date: 6/30/2026 |
| Next Release Date: 7/31/2026 |