|
Download Data (XLS File) |
|
|||||
|
|||||
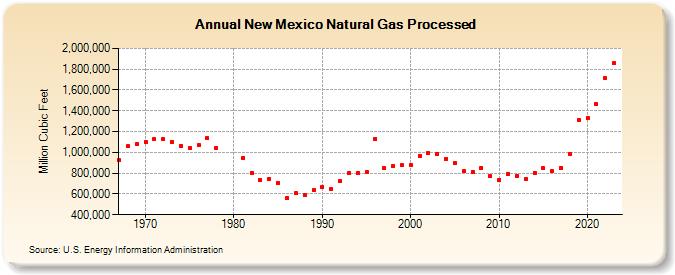
| New Mexico Natural Gas Processed (Million Cubic Feet) | |||||
| Decade | Year-0 | Year-1 | Year-2 | Year-3 | Year-4 | Year-5 | Year-6 | Year-7 | Year-8 | Year-9 |
|---|---|---|---|---|---|---|---|---|---|---|
| 1960's | 923,202 | 1,058,587 | 1,079,492 | |||||||
| 1970's | 1,101,442 | 1,124,139 | 1,126,192 | 1,101,341 | 1,060,491 | 1,037,160 | 1,066,104 | 1,136,254 | 1,040,098 | |
| 1980's | 948,680 | 799,990 | 735,882 | 747,412 | 709,601 | 561,369 | 605,035 | 591,837 | 638,498 | |
| 1990's | 665,232 | 646,116 | 722,433 | 804,536 | 800,836 | 809,893 | 1,129,598 | 851,305 | 868,209 | 873,801 |
| 2000's | 880,463 | 966,882 | 994,953 | 987,762 | 940,295 | 893,586 | 817,261 | 811,312 | 853,470 | 769,783 |
| 2010's | 737,187 | 795,069 | 777,099 | 746,010 | 802,343 | 845,333 | 815,852 | 852,796 | 983,603 | 1,313,642 |
| 2020's | 1,334,323 | 1,464,364 | 1,710,803 | 1,787,158 | 1,799,279 |
| - = No Data Reported; -- = Not Applicable; NA = Not Available; W = Withheld to avoid disclosure of individual company data. |
| Release Date: 6/30/2026 |
| Next Release Date: 7/31/2026 |