|
Download Data (XLS File) |
|
|||||
|
|||||
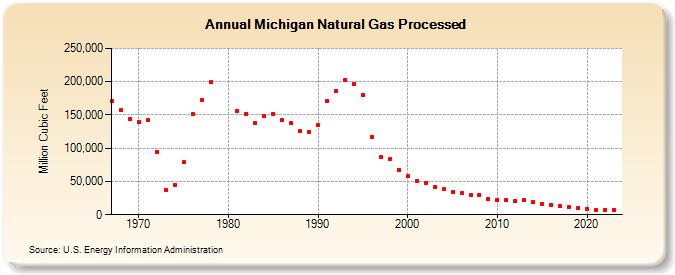
| Michigan Natural Gas Processed (Million Cubic Feet) | |||||
| Decade | Year-0 | Year-1 | Year-2 | Year-3 | Year-4 | Year-5 | Year-6 | Year-7 | Year-8 | Year-9 |
|---|---|---|---|---|---|---|---|---|---|---|
| 1960's | 171,531 | 156,996 | 143,802 | |||||||
| 1970's | 139,571 | 141,784 | 94,738 | 37,384 | 45,106 | 79,154 | 151,318 | 172,578 | 199,347 | |
| 1980's | 155,984 | 151,560 | 137,364 | 148,076 | 151,393 | 142,255 | 137,687 | 125,183 | 123,578 | |
| 1990's | 134,550 | 170,574 | 186,144 | 201,985 | 196,000 | 179,678 | 117,119 | 86,564 | 83,052 | 67,514 |
| 2000's | 58,482 | 50,734 | 47,292 | 41,619 | 37,977 | 34,545 | 33,213 | 29,436 | 30,008 | 23,819 |
| 2010's | 22,405 | 21,518 | 21,243 | 21,416 | 18,654 | 16,288 | 14,954 | 13,634 | 11,783 | 9,977 |
| 2020's | 7,916 | 7,515 | 7,270 | 7,219 | 6,519 |
| - = No Data Reported; -- = Not Applicable; NA = Not Available; W = Withheld to avoid disclosure of individual company data. |
| Release Date: 5/29/2026 |
| Next Release Date: 6/30/2026 |