|
Download Data (XLS File) |
|
|||||
|
|||||
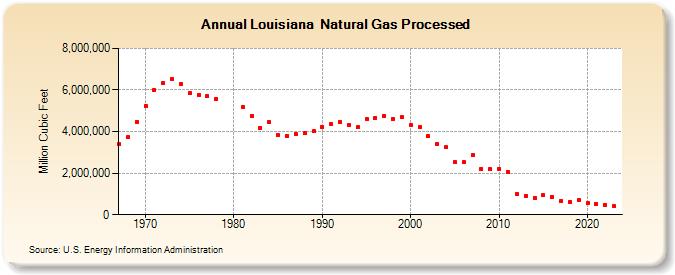
| Louisiana Natural Gas Processed (Million Cubic Feet) | |||||
| Decade | Year-0 | Year-1 | Year-2 | Year-3 | Year-4 | Year-5 | Year-6 | Year-7 | Year-8 | Year-9 |
|---|---|---|---|---|---|---|---|---|---|---|
| 1960's | 3,383,334 | 3,728,717 | 4,465,379 | |||||||
| 1970's | 5,237,519 | 5,994,431 | 6,337,328 | 6,524,729 | 6,273,136 | 5,831,487 | 5,749,783 | 5,709,535 | 5,561,040 | |
| 1980's | 5,197,429 | 4,770,095 | 4,190,105 | 4,439,430 | 3,811,852 | 3,794,464 | 3,880,364 | 3,918,236 | 4,002,843 | |
| 1990's | 4,220,068 | 4,340,531 | 4,466,425 | 4,315,312 | 4,200,126 | 4,604,292 | 4,652,677 | 4,767,965 | 4,610,969 | 4,687,261 |
| 2000's | 4,316,127 | 4,206,470 | 3,771,001 | 3,391,870 | 3,244,850 | 2,527,636 | 2,511,802 | 2,857,443 | 2,208,920 | 2,175,026 |
| 2010's | 2,207,760 | 2,048,175 | 978,100 | 923,772 | 823,742 | 930,816 | 871,612 | 662,429 | 631,609 | 684,260 |
| 2020's | 551,294 | 499,148 | 480,320 | 404,964 | 317,857 |
| - = No Data Reported; -- = Not Applicable; NA = Not Available; W = Withheld to avoid disclosure of individual company data. |
| Release Date: 6/30/2026 |
| Next Release Date: 7/31/2026 |