|
Download Data (XLS File) |
|
|||||
|
|||||
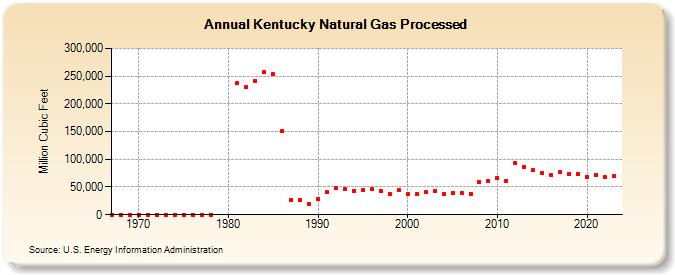
| Kentucky Natural Gas Processed (Million Cubic Feet) | |||||
| Decade | Year-0 | Year-1 | Year-2 | Year-3 | Year-4 | Year-5 | Year-6 | Year-7 | Year-8 | Year-9 |
|---|---|---|---|---|---|---|---|---|---|---|
| 1960's | 0 | 0 | 0 | |||||||
| 1970's | 0 | 0 | 0 | 0 | 0 | 0 | 0 | 0 | 0 | |
| 1980's | 237,759 | 230,940 | 241,558 | 256,522 | 253,652 | 150,627 | 26,888 | 26,673 | 18,707 | |
| 1990's | 28,379 | 40,966 | 47,425 | 45,782 | 42,877 | 44,734 | 46,015 | 43,352 | 37,929 | 44,064 |
| 2000's | 36,734 | 36,901 | 41,078 | 42,758 | 38,208 | 38,792 | 39,559 | 38,158 | 58,899 | 60,167 |
| 2010's | 66,579 | 60,941 | 92,883 | 85,549 | 79,985 | 75,162 | 71,836 | 77,043 | 73,498 | 74,148 |
| 2020's | 68,058 | 72,505 | 67,210 | 70,308 | 70,275 |
| - = No Data Reported; -- = Not Applicable; NA = Not Available; W = Withheld to avoid disclosure of individual company data. |
| Release Date: 6/30/2026 |
| Next Release Date: 7/31/2026 |