|
Download Data (XLS File) |
|
|||||
|
|||||
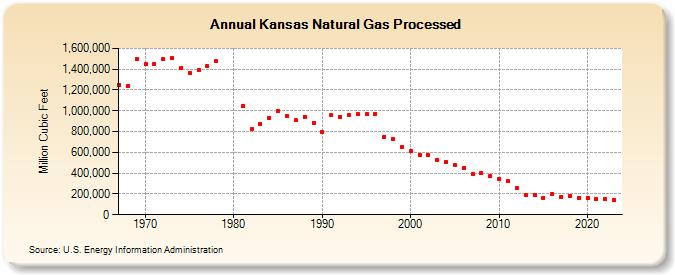
| Kansas Natural Gas Processed (Million Cubic Feet) | |||||
| Decade | Year-0 | Year-1 | Year-2 | Year-3 | Year-4 | Year-5 | Year-6 | Year-7 | Year-8 | Year-9 |
|---|---|---|---|---|---|---|---|---|---|---|
| 1960's | 1,250,286 | 1,239,723 | 1,493,907 | |||||||
| 1970's | 1,445,817 | 1,451,438 | 1,497,319 | 1,503,660 | 1,407,239 | 1,367,949 | 1,389,850 | 1,427,654 | 1,476,110 | |
| 1980's | 1,046,516 | 825,440 | 874,488 | 926,348 | 997,710 | 951,222 | 908,673 | 943,335 | 885,253 | |
| 1990's | 794,705 | 955,040 | 943,923 | 961,518 | 965,674 | 965,266 | 970,163 | 749,423 | 732,828 | 653,515 |
| 2000's | 610,039 | 576,231 | 572,044 | 530,938 | 507,172 | 476,656 | 453,111 | 391,022 | 397,587 | 370,670 |
| 2010's | 341,778 | 322,944 | 259,565 | 190,503 | 191,034 | 163,788 | 199,492 | 173,878 | 180,687 | 164,095 |
| 2020's | 164,834 | 151,859 | 151,442 | 144,028 | 127,311 |
| - = No Data Reported; -- = Not Applicable; NA = Not Available; W = Withheld to avoid disclosure of individual company data. |
| Release Date: 6/30/2026 |
| Next Release Date: 7/31/2026 |