|
Download Data (XLS File) |
|
|||||
|
|||||
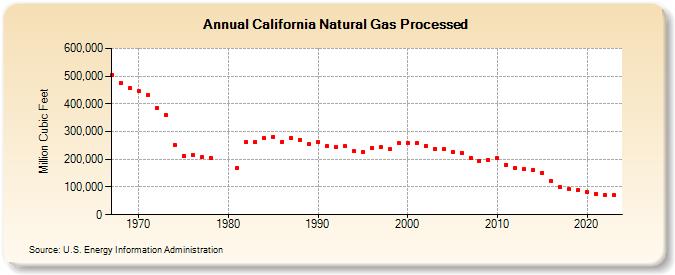
| California Natural Gas Processed (Million Cubic Feet) | |||||
| Decade | Year-0 | Year-1 | Year-2 | Year-3 | Year-4 | Year-5 | Year-6 | Year-7 | Year-8 | Year-9 |
|---|---|---|---|---|---|---|---|---|---|---|
| 1960's | 505,063 | 476,596 | 455,692 | |||||||
| 1970's | 444,700 | 431,605 | 386,664 | 359,841 | 252,402 | 213,079 | 216,667 | 206,981 | 204,693 | |
| 1980's | 169,812 | 261,725 | 263,475 | 276,209 | 281,389 | 263,823 | 276,969 | 270,191 | 254,286 | |
| 1990's | 263,667 | 246,335 | 243,692 | 246,283 | 228,346 | 226,548 | 240,566 | 243,054 | 235,558 | 259,518 |
| 2000's | 260,049 | 258,271 | 249,671 | 238,743 | 236,465 | 226,230 | 223,580 | 206,239 | 195,272 | 198,213 |
| 2010's | 204,327 | 180,648 | 169,203 | 164,401 | 162,794 | 150,561 | 120,313 | 100,780 | 92,272 | 88,856 |
| 2020's | 81,643 | 75,319 | 72,315 | 70,724 | 64,837 |
| - = No Data Reported; -- = Not Applicable; NA = Not Available; W = Withheld to avoid disclosure of individual company data. |
| Release Date: 6/30/2026 |
| Next Release Date: 7/31/2026 |