|
Download Data (XLS File) |
|
|||||
|
|||||
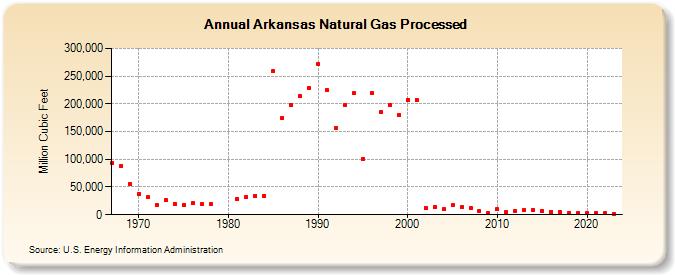
| Arkansas Natural Gas Processed (Million Cubic Feet) | |||||
| Decade | Year-0 | Year-1 | Year-2 | Year-3 | Year-4 | Year-5 | Year-6 | Year-7 | Year-8 | Year-9 |
|---|---|---|---|---|---|---|---|---|---|---|
| 1960's | 93,452 | 88,011 | 56,190 | |||||||
| 1970's | 37,816 | 31,387 | 17,946 | 26,135 | 19,784 | 17,918 | 20,370 | 18,630 | 18,480 | |
| 1980's | 29,003 | 31,530 | 33,753 | 34,572 | 258,648 | 174,872 | 197,781 | 213,558 | 228,157 | |
| 1990's | 272,278 | 224,625 | 156,573 | 198,074 | 218,710 | 100,720 | 219,477 | 185,244 | 198,148 | 179,524 |
| 2000's | 207,045 | 207,352 | 12,635 | 13,725 | 10,139 | 16,756 | 13,702 | 11,532 | 6,531 | 2,352 |
| 2010's | 9,599 | 5,611 | 6,872 | 7,781 | 8,058 | 7,084 | 5,410 | 4,096 | 3,611 | 3,430 |
| 2020's | 2,860 | 2,477 | 2,399 | 2,056 | 1,683 |
| - = No Data Reported; -- = Not Applicable; NA = Not Available; W = Withheld to avoid disclosure of individual company data. |
| Release Date: 6/30/2026 |
| Next Release Date: 7/31/2026 |