|
Download Data (XLS File) |
|
|||||
|
|||||
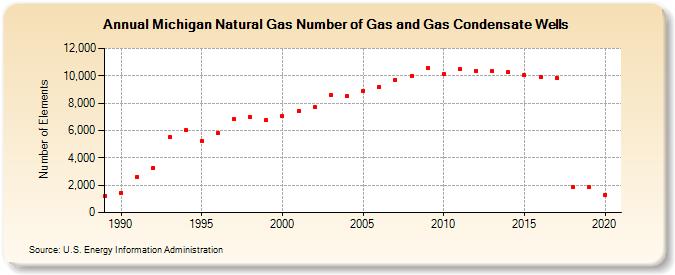
| Michigan Natural Gas Number of Gas and Gas Condensate Wells (Number of Elements) | |||||
| Decade | Year-0 | Year-1 | Year-2 | Year-3 | Year-4 | Year-5 | Year-6 | Year-7 | Year-8 | Year-9 |
|---|---|---|---|---|---|---|---|---|---|---|
| 1980's | 1,207 | |||||||||
| 1990's | 1,438 | 2,620 | 3,257 | 5,500 | 6,000 | 5,258 | 5,826 | 6,825 | 7,000 | 6,750 |
| 2000's | 7,068 | 7,425 | 7,700 | 8,600 | 8,500 | 8,900 | 9,200 | 9,712 | 9,995 | 10,600 |
| 2010's | 10,100 | 10,480 | 10,381 | 10,322 | 10,246 | 10,028 | 9,935 | 9,809 | 1,891 | 1,838 |
| 2020's | 1,308 |
| - = No Data Reported; -- = Not Applicable; NA = Not Available; W = Withheld to avoid disclosure of individual company data. |
| Release Date: 6/30/2026 |
| Next Release Date: 7/31/2026 |