|
Download Data (XLS File) |
|
||||||||
|
||||||||
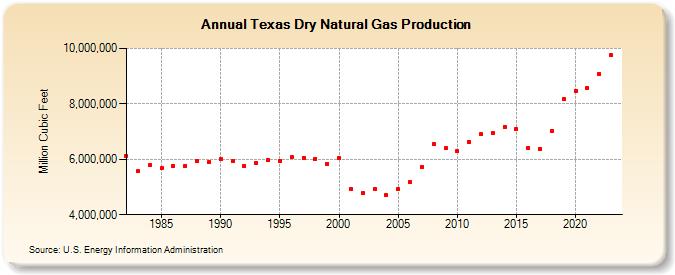
| Texas Dry Natural Gas Production (Million Cubic Feet) | ||||||||
| Decade | Year-0 | Year-1 | Year-2 | Year-3 | Year-4 | Year-5 | Year-6 | Year-7 | Year-8 | Year-9 |
|---|---|---|---|---|---|---|---|---|---|---|
| 1980's | 6,112,411 | 5,562,712 | 5,791,148 | 5,668,944 | 5,767,082 | 5,761,838 | 5,928,273 | 5,898,192 | ||
| 1990's | 6,000,960 | 5,926,917 | 5,771,736 | 5,864,561 | 5,972,824 | 5,948,336 | 6,072,178 | 6,062,699 | 6,020,433 | 5,839,047 |
| 2000's | 6,037,631 | 4,926,863 | 4,780,540 | 4,911,162 | 4,707,205 | 4,920,812 | 5,174,672 | 5,735,831 | 6,559,190 | 6,394,931 |
| 2010's | 6,281,672 | 6,631,555 | 6,896,085 | 6,943,731 | 7,178,225 | 7,080,338 | 6,406,450 | 6,383,240 | 7,029,257 | 8,170,468 |
| 2020's | 8,476,130 | 8,576,577 | 9,078,816 | 9,628,054 | 10,054,195 |
| - = No Data Reported; -- = Not Applicable; NA = Not Available; W = Withheld to avoid disclosure of individual company data. |
| Release Date: 6/30/2026 |
| Next Release Date: 7/31/2026 |