|
Download Data (XLS File) |
|
||||||||
|
||||||||
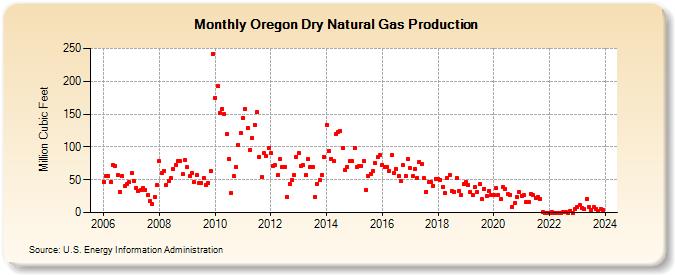
| Oregon Dry Natural Gas Production (Million Cubic Feet) | ||||||||
| Year | Jan | Feb | Mar | Apr | May | Jun | Jul | Aug | Sep | Oct | Nov | Dec |
|---|---|---|---|---|---|---|---|---|---|---|---|---|
| 2006 | 47 | 56 | 56 | 46 | 72 | 71 | 57 | 32 | 56 | 40 | 43 | 46 |
| 2007 | 60 | 48 | 38 | 33 | 35 | 38 | 35 | 27 | 18 | 13 | 24 | 42 |
| 2008 | 78 | 60 | 64 | 42 | 48 | 53 | 66 | 73 | 78 | 78 | 58 | 80 |
| 2009 | 69 | 55 | 60 | 46 | 57 | 45 | 45 | 53 | 42 | 45 | 63 | 242 |
| 2010 | 175 | 193 | 152 | 158 | 150 | 119 | 82 | 30 | 55 | 69 | 103 | 121 |
| 2011 | 144 | 158 | 129 | 96 | 114 | 134 | 153 | 85 | 54 | 90 | 86 | 98 |
| 2012 | 90 | 71 | 72 | 57 | 81 | 69 | 70 | 24 | 44 | 49 | 57 | 85 |
| 2013 | 90 | 71 | 72 | 57 | 81 | 69 | 70 | 24 | 44 | 49 | 57 | 85 |
| 2014 | 134 | 93 | 82 | 79 | 119 | 123 | 124 | 99 | 65 | 70 | 78 | 78 |
| 2015 | 99 | 69 | 71 | 71 | 79 | 35 | 55 | 59 | 63 | 75 | 84 | 88 |
| 2016 | 73 | 69 | 69 | 64 | 87 | 60 | 67 | 56 | 48 | 72 | 56 | 81 |
| 2017 | 68 | 55 | 67 | 53 | 77 | 74 | 52 | 32 | 46 | 46 | 41 | 51 |
| 2018 | 51 | 50 | 39 | 30 | 52 | 57 | 33 | 32 | 53 | 33 | 27 | 43 |
| 2019 | 46 | 42 | 31 | 26 | 39 | 32 | 43 | 20 | 36 | 25 | 33 | 26 |
| 2020 | 27 | 37 | 27 | 20 | 39 | 36 | 28 | 27 | 9 | 15 | 24 | 31 |
| 2021 | 25 | 26 | 16 | 16 | 29 | 26 | 22 | 23 | 21 | 1 | 0 | 0 |
| 2022 | 0 | 1 | 0 | 0 | 0 | 0 | 1 | 1 | 0 | 3 | 0 | 5 |
| 2023 | 8 | 11 | 7 | 5 | 21 | 9 | 4 | 8 | 6 | 2 | 6 | 4 |
| 2024 | 2 | 3 | 3 | 3 | 7 | 5 | 7 | 15 | 15 | 11 | 5 | 8 |
| - = No Data Reported; -- = Not Applicable; NA = Not Available; W = Withheld to avoid disclosure of individual company data. |
| Release Date: 5/29/2026 |
| Next Release Date: 6/30/2026 |