|
Download Data (XLS File) |
|
||||||||
|
||||||||
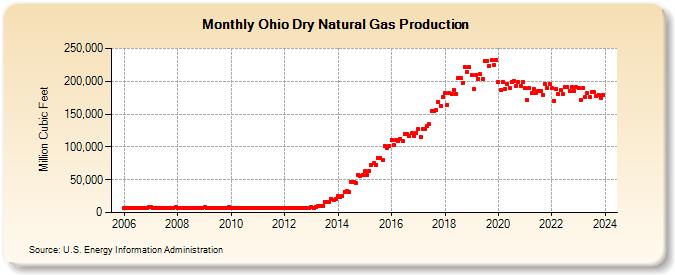
| Ohio Dry Natural Gas Production (Million Cubic Feet) | ||||||||
| Year | Jan | Feb | Mar | Apr | May | Jun | Jul | Aug | Sep | Oct | Nov | Dec |
|---|---|---|---|---|---|---|---|---|---|---|---|---|
| 2006 | 7,654 | 6,838 | 7,366 | 7,066 | 7,116 | 6,830 | 6,936 | 6,938 | 6,841 | 7,449 | 7,463 | 7,814 |
| 2007 | 7,812 | 6,979 | 7,518 | 7,211 | 7,263 | 6,971 | 7,078 | 7,080 | 6,981 | 7,602 | 7,616 | 7,975 |
| 2008 | 7,525 | 6,723 | 7,242 | 6,947 | 6,996 | 6,715 | 6,819 | 6,821 | 6,726 | 7,323 | 7,337 | 7,682 |
| 2009 | 7,876 | 7,038 | 7,581 | 7,272 | 7,324 | 7,030 | 7,138 | 7,140 | 7,041 | 7,665 | 7,679 | 8,040 |
| 2010 | 6,926 | 6,191 | 6,667 | 6,396 | 6,441 | 6,184 | 6,279 | 6,280 | 6,193 | 6,741 | 6,754 | 7,070 |
| 2011 | 6,993 | 6,248 | 6,730 | 6,456 | 6,502 | 6,240 | 6,337 | 6,339 | 6,250 | 6,806 | 6,818 | 7,139 |
| 2012 | 7,142 | 6,682 | 7,143 | 6,912 | 7,143 | 6,912 | 7,142 | 7,142 | 6,912 | 7,142 | 6,912 | 7,142 |
| 2013 | 8,278 | 7,476 | 8,278 | 10,210 | 10,551 | 10,210 | 16,747 | 16,748 | 16,208 | 19,947 | 19,301 | 19,948 |
| 2014 | 25,580 | 23,047 | 25,497 | 31,428 | 32,491 | 31,429 | 46,575 | 46,559 | 45,058 | 57,741 | 55,896 | 57,737 |
| 2015 | 62,677 | 56,589 | 62,630 | 72,448 | 74,937 | 72,531 | 82,744 | 82,738 | 80,038 | 101,224 | 97,979 | 101,245 |
| 2016 | 110,252 | 103,059 | 110,236 | 108,456 | 112,140 | 108,579 | 119,857 | 119,905 | 116,075 | 120,733 | 116,791 | 120,751 |
| 2017 | 127,063 | 114,706 | 126,887 | 127,288 | 131,531 | 134,402 | 153,968 | 153,971 | 155,777 | 168,020 | 162,442 | 175,636 |
| 2018 | 181,595 | 163,927 | 181,432 | 181,228 | 187,210 | 181,146 | 204,595 | 204,488 | 197,806 | 221,566 | 214,324 | 221,496 |
| 2019 | 209,037 | 188,782 | 208,989 | 203,817 | 210,578 | 203,774 | 231,095 | 230,989 | 223,521 | 232,234 | 224,670 | 232,165 |
| 2020 | 199,143 | 186,300 | 199,140 | 188,771 | 195,316 | 188,960 | 199,576 | 199,589 | 193,147 | 199,000 | 192,459 | 198,868 |
| 2021 | 189,143 | 171,098 | 189,105 | 181,529 | 187,583 | 181,545 | 185,657 | 185,645 | 179,630 | 195,889 | 189,526 | 195,808 |
| 2022 | 188,922 | 170,605 | 188,820 | 179,991 | 185,988 | 179,977 | 191,213 | 191,187 | 184,958 | 190,511 | 184,360 | 190,565 |
| 2023 | 189,885 | 171,527 | 189,834 | 176,253 | 182,087 | 176,270 | 183,998 | 183,967 | 178,023 | 180,453 | 174,557 | 180,368 |
| 2024 | 178,371 | 166,705 | 178,338 | 170,162 | 175,825 | 170,082 | 174,558 | 174,616 | 169,025 | 176,869 | 171,162 | 176,753 |
| - = No Data Reported; -- = Not Applicable; NA = Not Available; W = Withheld to avoid disclosure of individual company data. |
| Release Date: 6/30/2026 |
| Next Release Date: 7/31/2026 |