|
Download Data (XLS File) |
|
||||||||
|
||||||||
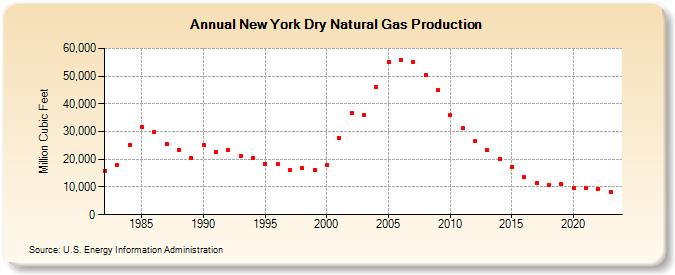
| New York Dry Natural Gas Production (Million Cubic Feet) | ||||||||
| Decade | Year-0 | Year-1 | Year-2 | Year-3 | Year-4 | Year-5 | Year-6 | Year-7 | Year-8 | Year-9 |
|---|---|---|---|---|---|---|---|---|---|---|
| 1980's | 15,877 | 17,836 | 25,200 | 31,561 | 29,964 | 25,676 | 23,455 | 20,433 | ||
| 1990's | 25,023 | 22,777 | 23,508 | 21,183 | 20,465 | 18,400 | 18,131 | 16,188 | 16,699 | 16,122 |
| 2000's | 17,757 | 27,787 | 36,816 | 36,137 | 46,050 | 55,180 | 55,980 | 54,942 | 50,320 | 44,849 |
| 2010's | 35,813 | 31,124 | 26,424 | 23,458 | 20,201 | 17,325 | 13,523 | 11,395 | 10,653 | 10,962 |
| 2020's | 9,657 | 9,708 | 9,441 | 8,336 | 8,836 |
| - = No Data Reported; -- = Not Applicable; NA = Not Available; W = Withheld to avoid disclosure of individual company data. |
| Release Date: 6/30/2026 |
| Next Release Date: 7/31/2026 |