|
Download Data (XLS File) |
|
||||||||
|
||||||||
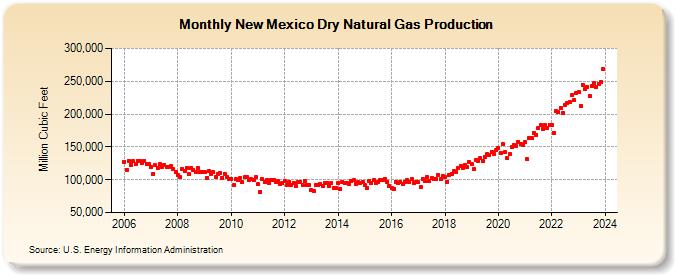
| New Mexico Dry Natural Gas Production (Million Cubic Feet) | ||||||||
| Year | Jan | Feb | Mar | Apr | May | Jun | Jul | Aug | Sep | Oct | Nov | Dec |
|---|---|---|---|---|---|---|---|---|---|---|---|---|
| 2006 | 127,437 | 115,388 | 128,902 | 122,927 | 128,084 | 124,586 | 129,037 | 129,014 | 125,936 | 129,125 | 124,185 | 124,630 |
| 2007 | 119,393 | 109,187 | 121,690 | 117,659 | 123,424 | 119,500 | 122,821 | 119,157 | 119,563 | 121,079 | 116,311 | 111,886 |
| 2008 | 107,116 | 104,184 | 116,572 | 113,727 | 117,935 | 108,215 | 118,203 | 115,370 | 111,828 | 118,098 | 111,215 | 111,162 |
| 2009 | 111,273 | 103,156 | 112,939 | 108,259 | 111,243 | 104,631 | 108,759 | 110,345 | 103,173 | 109,398 | 104,277 | 100,711 |
| 2010 | 101,117 | 91,571 | 100,542 | 99,013 | 102,984 | 95,917 | 103,456 | 103,411 | 99,496 | 100,358 | 98,903 | 103,456 |
| 2011 | 93,017 | 82,059 | 101,243 | 96,076 | 99,578 | 95,476 | 99,568 | 99,557 | 95,986 | 97,352 | 92,774 | 94,326 |
| 2012 | 98,145 | 91,858 | 96,880 | 92,414 | 95,555 | 90,160 | 96,212 | 96,441 | 91,785 | 98,310 | 92,240 | 91,209 |
| 2013 | 84,031 | 82,122 | 92,204 | 92,571 | 93,241 | 91,066 | 94,581 | 95,224 | 89,987 | 94,864 | 87,359 | 87,594 |
| 2014 | 94,629 | 86,058 | 97,220 | 94,387 | 94,858 | 94,151 | 98,329 | 99,283 | 93,988 | 96,038 | 94,778 | 96,908 |
| 2015 | 91,973 | 87,500 | 97,741 | 95,405 | 99,122 | 95,253 | 96,479 | 99,714 | 98,909 | 101,370 | 97,178 | 90,849 |
| 2016 | 87,025 | 86,350 | 96,536 | 94,327 | 96,424 | 92,952 | 97,087 | 99,906 | 96,895 | 100,367 | 95,584 | 96,373 |
| 2017 | 95,819 | 88,836 | 100,988 | 97,748 | 103,903 | 97,935 | 102,594 | 101,322 | 101,128 | 106,986 | 100,597 | 105,352 |
| 2018 | 103,516 | 97,235 | 107,467 | 109,467 | 113,206 | 111,942 | 118,333 | 121,406 | 117,485 | 122,359 | 118,954 | 126,571 |
| 2019 | 124,072 | 115,739 | 130,778 | 128,814 | 132,811 | 128,311 | 134,682 | 138,965 | 137,668 | 142,691 | 139,935 | 144,710 |
| 2020 | 147,592 | 140,961 | 153,941 | 141,831 | 132,918 | 138,681 | 150,163 | 153,307 | 151,201 | 157,871 | 153,748 | 153,377 |
| 2021 | 157,600 | 131,132 | 164,158 | 162,820 | 171,358 | 168,692 | 179,174 | 182,584 | 177,950 | 183,327 | 178,485 | 183,628 |
| 2022 | 183,839 | 171,711 | 204,475 | 202,416 | 208,868 | 202,330 | 214,283 | 217,345 | 218,972 | 228,909 | 220,650 | 232,368 |
| 2023 | 233,793 | 212,728 | 246,804 | 239,494 | 243,505 | 228,134 | 242,575 | 247,144 | 240,801 | 246,973 | 249,930 | 267,940 |
| 2024 | 252,983 | 251,213 | 273,418 | 261,572 | 271,187 | 265,788 | 283,695 | 289,958 | 283,122 | 299,444 | 290,160 | 306,861 |
| - = No Data Reported; -- = Not Applicable; NA = Not Available; W = Withheld to avoid disclosure of individual company data. |
| Release Date: 6/30/2026 |
| Next Release Date: 7/31/2026 |