|
Download Data (XLS File) |
|
||||||||
|
||||||||
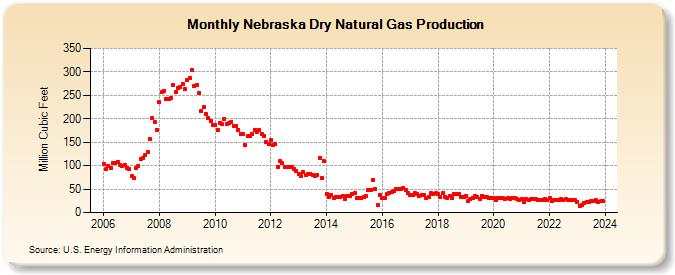
| Nebraska Dry Natural Gas Production (Million Cubic Feet) | ||||||||
| Year | Jan | Feb | Mar | Apr | May | Jun | Jul | Aug | Sep | Oct | Nov | Dec |
|---|---|---|---|---|---|---|---|---|---|---|---|---|
| 2006 | 103 | 92 | 100 | 95 | 105 | 105 | 108 | 102 | 100 | 102 | 95 | 93 |
| 2007 | 77 | 73 | 96 | 99 | 115 | 116 | 122 | 129 | 156 | 202 | 193 | 177 |
| 2008 | 235 | 257 | 260 | 243 | 243 | 245 | 272 | 256 | 265 | 267 | 275 | 263 |
| 2009 | 283 | 287 | 303 | 269 | 273 | 255 | 217 | 226 | 211 | 202 | 195 | 187 |
| 2010 | 187 | 177 | 191 | 188 | 200 | 189 | 191 | 194 | 185 | 184 | 177 | 168 |
| 2011 | 168 | 143 | 163 | 164 | 168 | 177 | 172 | 176 | 167 | 164 | 151 | 146 |
| 2012 | 155 | 145 | 147 | 98 | 109 | 105 | 97 | 97 | 98 | 97 | 93 | 88 |
| 2013 | 82 | 77 | 87 | 81 | 82 | 83 | 81 | 78 | 81 | 117 | 74 | 109 |
| 2014 | 40 | 33 | 37 | 32 | 34 | 33 | 34 | 36 | 28 | 36 | 35 | 39 |
| 2015 | 41 | 32 | 32 | 32 | 34 | 35 | 49 | 49 | 69 | 50 | 17 | 37 |
| 2016 | 31 | 30 | 40 | 41 | 43 | 45 | 51 | 50 | 51 | 53 | 48 | 41 |
| 2017 | 38 | 37 | 42 | 40 | 36 | 38 | 38 | 30 | 33 | 41 | 40 | 41 |
| 2018 | 40 | 34 | 41 | 34 | 32 | 36 | 31 | 40 | 39 | 39 | 34 | 34 |
| 2019 | 36 | 25 | 28 | 32 | 36 | 33 | 29 | 36 | 34 | 34 | 31 | 30 |
| 2020 | 30 | 26 | 31 | 30 | 30 | 28 | 30 | 29 | 30 | 31 | 28 | 27 |
| 2021 | 29 | 23 | 28 | 27 | 28 | 28 | 28 | 27 | 27 | 27 | 28 | 26 |
| 2022 | 30 | 25 | 26 | 26 | 27 | 28 | 26 | 28 | 27 | 27 | 26 | 26 |
| 2023 | 22 | 14 | 17 | 21 | 23 | 23 | 24 | 24 | 26 | 23 | 24 | 25 |
| 2024 | 26 | 0 | 23 | 24 | 24 | 23 | 22 | 23 | 22 | 24 | 24 | 25 |
| - = No Data Reported; -- = Not Applicable; NA = Not Available; W = Withheld to avoid disclosure of individual company data. |
| Release Date: 6/30/2026 |
| Next Release Date: 7/31/2026 |