|
Download Data (XLS File) |
|
||||||||
|
||||||||
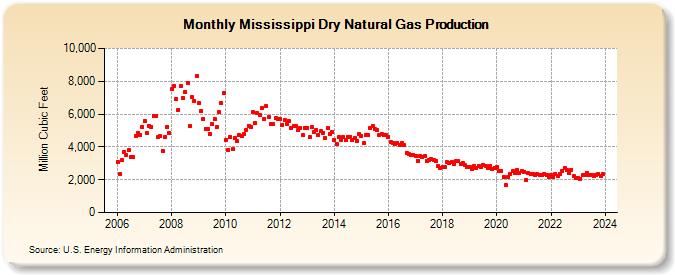
| Mississippi Dry Natural Gas Production (Million Cubic Feet) | ||||||||
| Year | Jan | Feb | Mar | Apr | May | Jun | Jul | Aug | Sep | Oct | Nov | Dec |
|---|---|---|---|---|---|---|---|---|---|---|---|---|
| 2006 | 3,091 | 2,334 | 3,199 | 3,696 | 3,506 | 3,804 | 3,410 | 3,383 | 4,657 | 4,850 | 4,726 | 5,213 |
| 2007 | 5,557 | 4,821 | 5,290 | 5,225 | 5,893 | 5,906 | 4,586 | 4,655 | 3,756 | 4,590 | 5,237 | 4,847 |
| 2008 | 7,506 | 7,722 | 6,936 | 6,274 | 7,681 | 6,976 | 7,347 | 7,921 | 5,291 | 7,039 | 6,796 | 8,307 |
| 2009 | 6,662 | 6,156 | 5,705 | 5,085 | 5,101 | 4,803 | 5,384 | 5,682 | 5,195 | 6,100 | 6,656 | 7,274 |
| 2010 | 4,424 | 3,807 | 4,610 | 3,842 | 4,561 | 4,336 | 4,709 | 4,674 | 4,764 | 5,053 | 5,302 | 5,233 |
| 2011 | 6,123 | 5,484 | 6,073 | 5,948 | 6,389 | 5,724 | 6,505 | 5,806 | 5,370 | 5,384 | 5,758 | 5,702 |
| 2012 | 5,722 | 5,357 | 5,631 | 5,383 | 5,549 | 5,146 | 5,253 | 5,268 | 5,011 | 5,147 | 4,722 | 5,167 |
| 2013 | 5,153 | 4,579 | 5,211 | 4,910 | 5,017 | 4,731 | 4,959 | 4,876 | 4,530 | 5,147 | 4,803 | 4,890 |
| 2014 | 4,418 | 4,173 | 4,615 | 4,407 | 4,610 | 4,417 | 4,589 | 4,611 | 4,433 | 4,545 | 4,366 | 4,766 |
| 2015 | 4,675 | 4,230 | 4,701 | 4,744 | 5,173 | 5,251 | 5,081 | 5,037 | 4,748 | 4,755 | 4,695 | 4,742 |
| 2016 | 4,612 | 4,273 | 4,246 | 4,202 | 4,230 | 4,125 | 4,232 | 4,112 | 3,648 | 3,559 | 3,484 | 3,519 |
| 2017 | 3,464 | 3,165 | 3,442 | 3,403 | 3,433 | 3,154 | 3,217 | 3,251 | 3,185 | 3,125 | 2,834 | 2,732 |
| 2018 | 2,786 | 2,753 | 3,094 | 3,011 | 3,084 | 2,977 | 3,138 | 3,117 | 2,956 | 3,000 | 2,878 | 2,763 |
| 2019 | 2,788 | 2,644 | 2,864 | 2,720 | 2,848 | 2,797 | 2,920 | 2,847 | 2,695 | 2,808 | 2,636 | 2,737 |
| 2020 | 2,767 | 2,531 | 2,543 | 2,179 | 1,665 | 2,183 | 2,379 | 2,528 | 2,409 | 2,581 | 2,421 | 2,508 |
| 2021 | 2,471 | 1,982 | 2,408 | 2,373 | 2,334 | 2,265 | 2,331 | 2,289 | 2,274 | 2,379 | 2,269 | 2,192 |
| 2022 | 2,281 | 2,157 | 2,355 | 2,233 | 2,331 | 2,512 | 2,684 | 2,595 | 2,388 | 2,622 | 2,221 | 2,126 |
| 2023 | 2,110 | 2,067 | 2,294 | 2,283 | 2,397 | 2,291 | 2,306 | 2,257 | 2,272 | 2,378 | 2,210 | 2,335 |
| 2024 | 2,352 | 2,149 | 2,213 | 2,150 | 2,184 | 2,056 | 2,113 | 2,099 | 1,995 | 2,129 | 2,097 | 2,214 |
| - = No Data Reported; -- = Not Applicable; NA = Not Available; W = Withheld to avoid disclosure of individual company data. |
| Release Date: 6/30/2026 |
| Next Release Date: 7/31/2026 |