|
Download Data (XLS File) |
|
||||||||
|
||||||||
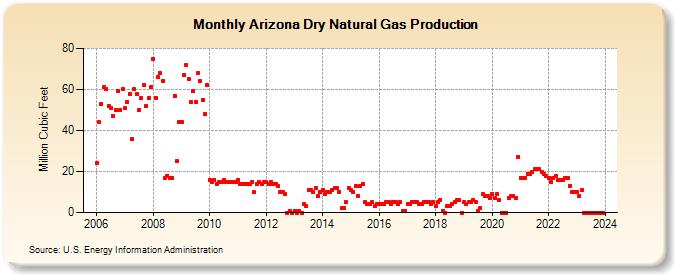
| Arizona Dry Natural Gas Production (Million Cubic Feet) | ||||||||
| Year | Jan | Feb | Mar | Apr | May | Jun | Jul | Aug | Sep | Oct | Nov | Dec |
|---|---|---|---|---|---|---|---|---|---|---|---|---|
| 2006 | 24 | 44 | 53 | 61 | 60 | 52 | 51 | 47 | 50 | 59 | 50 | 60 |
| 2007 | 51 | 54 | 58 | 36 | 60 | 58 | 50 | 56 | 62 | 52 | 56 | 61 |
| 2008 | 75 | 56 | 66 | 68 | 64 | 17 | 18 | 17 | 17 | 57 | 25 | 44 |
| 2009 | 44 | 67 | 72 | 65 | 54 | 59 | 54 | 68 | 64 | 55 | 48 | 62 |
| 2010 | 16 | 15 | 16 | 14 | 15 | 15 | 16 | 15 | 15 | 15 | 15 | 15 |
| 2011 | 16 | 14 | 14 | 14 | 14 | 14 | 15 | 10 | 14 | 15 | 14 | 15 |
| 2012 | 15 | 14 | 15 | 14 | 14 | 13 | 10 | 10 | 9 | 0 | 1 | 0 |
| 2013 | 1 | 0 | 1 | 0 | 4 | 3 | 11 | 11 | 10 | 12 | 8 | 10 |
| 2014 | 11 | 9 | 10 | 10 | 11 | 12 | 12 | 10 | 2 | 2 | 5 | 12 |
| 2015 | 11 | 10 | 13 | 8 | 13 | 14 | 5 | 4 | 4 | 5 | 3 | 4 |
| 2016 | 4 | 4 | 4 | 5 | 5 | 4 | 5 | 5 | 4 | 5 | 1 | 1 |
| 2017 | 4 | 4 | 5 | 5 | 5 | 4 | 4 | 5 | 5 | 5 | 4 | 5 |
| 2018 | 3 | 5 | 6 | 1 | 0 | 3 | 3 | 4 | 5 | 6 | 6 | 0 |
| 2019 | 5 | 4 | 5 | 5 | 6 | 5 | 1 | 2 | 9 | 8 | 8 | 7 |
| 2020 | 9 | 7 | 9 | 6 | 0 | 0 | 0 | 7 | 8 | 8 | 7 | 27 |
| 2021 | 17 | 17 | 17 | 19 | 19 | 20 | 21 | 21 | 21 | 20 | 19 | 18 |
| 2022 | 17 | 15 | 17 | 18 | 16 | 16 | 16 | 17 | 17 | 13 | 10 | 10 |
| 2023 | 14 | 11 | 13 | 13 | 16 | 17 | 17 | 16 | 15 | 14 | 12 | 13 |
| 2024 | 13 | 11 | 13 | 12 | 13 | 12 | 12 | 12 | 10 | 11 | 12 | 10 |
| - = No Data Reported; -- = Not Applicable; NA = Not Available; W = Withheld to avoid disclosure of individual company data. |
| Release Date: 6/30/2026 |
| Next Release Date: 7/31/2026 |