|
Download Data (XLS File) |
|
||||||||
|
||||||||
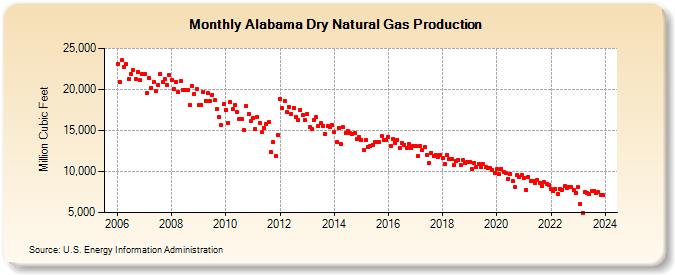
| Alabama Dry Natural Gas Production (Million Cubic Feet) | ||||||||
| Year | Jan | Feb | Mar | Apr | May | Jun | Jul | Aug | Sep | Oct | Nov | Dec |
|---|---|---|---|---|---|---|---|---|---|---|---|---|
| 2006 | 23,068 | 20,965 | 23,528 | 22,673 | 23,113 | 21,276 | 21,886 | 22,309 | 21,248 | 22,084 | 21,095 | 21,911 |
| 2007 | 21,865 | 19,575 | 21,444 | 20,217 | 20,863 | 19,763 | 20,509 | 21,924 | 20,846 | 21,254 | 20,587 | 21,727 |
| 2008 | 21,121 | 20,048 | 20,966 | 19,692 | 21,009 | 19,988 | 19,910 | 19,888 | 18,102 | 20,394 | 19,451 | 20,092 |
| 2009 | 18,047 | 18,112 | 19,722 | 18,630 | 19,546 | 18,558 | 19,364 | 18,677 | 17,622 | 16,696 | 15,613 | 18,209 |
| 2010 | 17,486 | 15,942 | 18,526 | 17,561 | 18,129 | 17,268 | 16,365 | 16,426 | 15,058 | 18,000 | 17,015 | 16,097 |
| 2011 | 16,512 | 15,155 | 16,609 | 15,939 | 14,788 | 15,342 | 15,803 | 15,992 | 12,335 | 13,540 | 11,831 | 14,462 |
| 2012 | 18,842 | 17,696 | 18,594 | 17,281 | 17,865 | 17,031 | 17,731 | 16,655 | 16,240 | 17,515 | 16,859 | 16,267 |
| 2013 | 17,044 | 15,398 | 15,186 | 16,251 | 16,584 | 15,547 | 15,856 | 15,605 | 14,619 | 15,576 | 15,363 | 15,621 |
| 2014 | 14,754 | 13,550 | 15,285 | 13,325 | 15,376 | 14,703 | 14,963 | 14,678 | 14,556 | 14,718 | 13,945 | 14,163 |
| 2015 | 13,873 | 12,631 | 13,839 | 12,959 | 13,072 | 13,261 | 13,562 | 13,638 | 13,546 | 14,315 | 13,842 | 13,896 |
| 2016 | 14,192 | 13,132 | 13,984 | 13,521 | 13,853 | 12,918 | 13,480 | 13,284 | 12,905 | 13,298 | 12,852 | 13,120 |
| 2017 | 13,168 | 11,897 | 13,163 | 12,568 | 12,957 | 12,051 | 11,072 | 12,264 | 11,865 | 12,042 | 11,743 | 12,029 |
| 2018 | 11,655 | 10,890 | 12,060 | 11,532 | 11,499 | 10,801 | 11,247 | 11,462 | 10,740 | 11,383 | 11,015 | 11,146 |
| 2019 | 11,149 | 10,273 | 11,071 | 10,568 | 10,950 | 10,586 | 10,933 | 10,576 | 10,388 | 10,368 | 10,235 | 9,782 |
| 2020 | 10,250 | 9,649 | 10,358 | 9,950 | 9,766 | 9,140 | 9,753 | 8,811 | 8,091 | 9,548 | 9,288 | 9,629 |
| 2021 | 9,252 | 7,785 | 9,359 | 8,797 | 8,903 | 8,646 | 8,968 | 8,662 | 8,291 | 8,740 | 8,431 | 8,351 |
| 2022 | 7,831 | 7,598 | 7,880 | 7,311 | 7,867 | 7,804 | 8,175 | 8,015 | 8,092 | 8,067 | 7,737 | 7,399 |
| 2023 | 8,057 | 6,091 | 5,003 | 7,521 | 7,390 | 7,235 | 7,571 | 7,672 | 7,396 | 7,454 | 7,198 | 7,116 |
| 2024 | 6,553 | 6,125 | 6,490 | 6,388 | 6,505 | 6,129 | 6,422 | 6,372 | 5,310 | 6,319 | 5,175 | 6,108 |
| - = No Data Reported; -- = Not Applicable; NA = Not Available; W = Withheld to avoid disclosure of individual company data. |
| Release Date: 6/30/2026 |
| Next Release Date: 7/31/2026 |