|
Download Data (XLS File) |
|
||||||||
|
||||||||
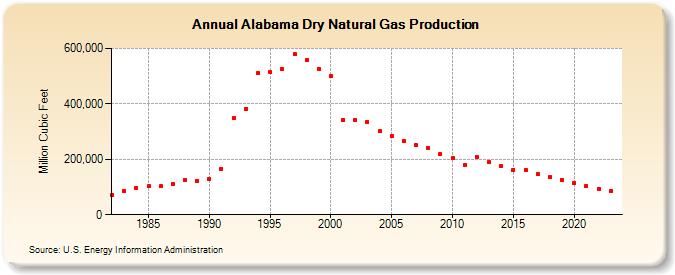
| Alabama Dry Natural Gas Production (Million Cubic Feet) | ||||||||
| Decade | Year-0 | Year-1 | Year-2 | Year-3 | Year-4 | Year-5 | Year-6 | Year-7 | Year-8 | Year-9 |
|---|---|---|---|---|---|---|---|---|---|---|
| 1980's | 70,276 | 86,092 | 96,699 | 102,106 | 102,348 | 112,354 | 124,750 | 123,389 | ||
| 1990's | 130,337 | 165,850 | 349,609 | 382,435 | 509,625 | 514,388 | 525,480 | 578,635 | 558,451 | 527,385 |
| 2000's | 499,589 | 343,056 | 341,235 | 334,852 | 300,888 | 282,769 | 265,155 | 250,576 | 240,662 | 218,797 |
| 2010's | 203,873 | 178,310 | 208,577 | 188,651 | 174,016 | 162,433 | 160,541 | 146,818 | 135,430 | 126,879 |
| 2020's | 114,235 | 104,185 | 93,776 | 85,705 | 73,894 |
| - = No Data Reported; -- = Not Applicable; NA = Not Available; W = Withheld to avoid disclosure of individual company data. |
| Release Date: 6/30/2026 |
| Next Release Date: 7/31/2026 |