|
Download Data (XLS File) |
|
||||||||
|
||||||||
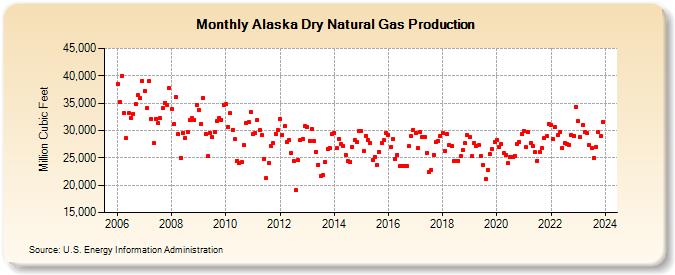
| Alaska Dry Natural Gas Production (Million Cubic Feet) | ||||||||
| Year | Jan | Feb | Mar | Apr | May | Jun | Jul | Aug | Sep | Oct | Nov | Dec |
|---|---|---|---|---|---|---|---|---|---|---|---|---|
| 2006 | 38,517 | 35,146 | 40,041 | 33,136 | 28,536 | 33,103 | 32,361 | 33,039 | 34,849 | 36,404 | 35,868 | 39,085 |
| 2007 | 37,127 | 34,071 | 38,968 | 32,142 | 27,624 | 32,121 | 31,327 | 32,224 | 34,137 | 35,074 | 34,644 | 37,694 |
| 2008 | 33,907 | 31,192 | 36,078 | 29,331 | 25,032 | 29,531 | 28,615 | 29,707 | 31,853 | 32,267 | 31,892 | 34,702 |
| 2009 | 33,793 | 31,201 | 35,892 | 29,428 | 25,276 | 29,555 | 28,739 | 29,769 | 31,704 | 32,211 | 31,920 | 34,664 |
| 2010 | 34,771 | 30,608 | 33,134 | 30,164 | 28,355 | 24,451 | 24,089 | 24,238 | 27,332 | 31,336 | 31,497 | 33,418 |
| 2011 | 29,275 | 29,526 | 31,994 | 30,107 | 29,180 | 24,866 | 21,238 | 24,126 | 27,235 | 27,634 | 29,427 | 30,061 |
| 2012 | 32,091 | 29,171 | 30,747 | 27,923 | 28,275 | 25,929 | 24,393 | 19,108 | 24,677 | 28,196 | 28,530 | 30,750 |
| 2013 | 30,609 | 28,147 | 30,274 | 28,053 | 26,157 | 23,754 | 21,678 | 21,837 | 24,203 | 26,615 | 26,832 | 29,345 |
| 2014 | 29,599 | 26,725 | 28,498 | 27,485 | 27,235 | 25,544 | 24,376 | 24,306 | 26,955 | 28,275 | 27,887 | 29,990 |
| 2015 | 29,970 | 26,176 | 29,039 | 28,303 | 27,641 | 24,568 | 25,197 | 23,690 | 26,153 | 27,697 | 28,259 | 29,463 |
| 2016 | 29,184 | 27,009 | 28,392 | 24,802 | 25,600 | 23,456 | 23,539 | 23,495 | 23,553 | 27,088 | 28,957 | 30,158 |
| 2017 | 29,476 | 26,729 | 29,740 | 28,819 | 28,794 | 25,940 | 22,387 | 22,790 | 25,594 | 27,841 | 28,068 | 28,903 |
| 2018 | 29,505 | 26,275 | 29,277 | 27,339 | 27,191 | 24,450 | 24,436 | 24,412 | 25,363 | 26,437 | 27,670 | 29,140 |
| 2019 | 28,882 | 25,254 | 27,707 | 27,222 | 27,368 | 25,278 | 23,674 | 21,161 | 22,828 | 25,674 | 26,548 | 27,907 |
| 2020 | 28,266 | 26,915 | 27,494 | 25,881 | 25,493 | 23,990 | 25,134 | 25,210 | 25,387 | 27,462 | 27,957 | 29,391 |
| 2021 | 29,917 | 26,901 | 29,716 | 27,791 | 27,225 | 25,999 | 24,490 | 26,069 | 26,785 | 28,622 | 28,938 | 31,166 |
| 2022 | 31,063 | 28,371 | 30,624 | 29,104 | 29,809 | 26,832 | 27,768 | 27,478 | 27,421 | 29,196 | 29,068 | 34,280 |
| 2023 | 31,669 | 28,766 | 30,934 | 29,640 | 29,519 | 27,298 | 26,715 | 24,983 | 27,064 | 29,756 | 28,988 | 31,550 |
| 2024 | 32,319 | 29,782 | 31,854 | 29,474 | 30,208 | 27,234 | 27,436 | 26,576 | 26,880 | 28,977 | 29,775 | 30,318 |
| - = No Data Reported; -- = Not Applicable; NA = Not Available; W = Withheld to avoid disclosure of individual company data. |
| Release Date: 6/30/2026 |
| Next Release Date: 7/31/2026 |