|
Download Data (XLS File) |
|
||||||||
|
||||||||
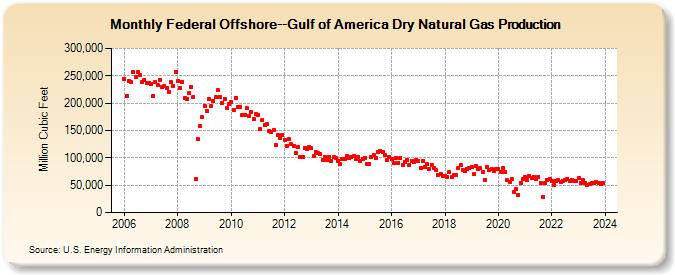
| Federal Offshore--Gulf of America Dry Natural Gas Production (Million Cubic Feet) | ||||||||
| Year | Jan | Feb | Mar | Apr | May | Jun | Jul | Aug | Sep | Oct | Nov | Dec |
|---|---|---|---|---|---|---|---|---|---|---|---|---|
| 2006 | 244,584 | 213,829 | 239,860 | 238,542 | 256,010 | 247,754 | 256,378 | 250,819 | 238,653 | 242,261 | 235,960 | 237,319 |
| 2007 | 235,396 | 213,877 | 238,889 | 232,357 | 242,298 | 228,908 | 231,048 | 228,054 | 221,195 | 238,095 | 231,929 | 256,671 |
| 2008 | 241,064 | 228,507 | 239,263 | 209,165 | 208,428 | 219,044 | 230,193 | 211,888 | 61,961 | 133,579 | 157,377 | 173,874 |
| 2009 | 195,525 | 184,696 | 207,335 | 195,000 | 203,298 | 210,961 | 223,920 | 211,532 | 200,721 | 207,439 | 190,220 | 198,268 |
| 2010 | 202,102 | 188,046 | 209,373 | 193,806 | 192,728 | 177,531 | 178,573 | 190,298 | 177,334 | 183,545 | 171,021 | 180,704 |
| 2011 | 178,597 | 152,160 | 168,311 | 160,766 | 162,416 | 149,309 | 147,208 | 149,986 | 123,410 | 141,464 | 137,005 | 141,696 |
| 2012 | 132,092 | 121,890 | 133,618 | 124,714 | 121,599 | 109,098 | 118,923 | 101,507 | 102,380 | 117,889 | 116,973 | 119,403 |
| 2013 | 117,090 | 103,307 | 110,573 | 108,525 | 107,281 | 96,958 | 102,059 | 96,715 | 101,689 | 94,741 | 100,791 | 99,225 |
| 2014 | 94,282 | 88,079 | 97,118 | 98,349 | 103,150 | 99,531 | 101,709 | 102,444 | 98,482 | 102,391 | 93,714 | 98,781 |
| 2015 | 99,635 | 88,355 | 89,300 | 100,884 | 105,034 | 99,253 | 110,318 | 112,793 | 110,047 | 104,557 | 95,279 | 101,925 |
| 2016 | 98,071 | 90,690 | 100,478 | 91,299 | 100,095 | 87,301 | 92,729 | 95,675 | 87,772 | 94,446 | 91,892 | 96,164 |
| 2017 | 94,338 | 82,116 | 94,412 | 83,877 | 88,059 | 79,753 | 86,581 | 81,521 | 77,232 | 68,931 | 70,495 | 66,965 |
| 2018 | 67,609 | 65,054 | 73,411 | 65,611 | 67,738 | 68,850 | 80,895 | 86,860 | 77,871 | 75,035 | 79,266 | 80,797 |
| 2019 | 83,127 | 70,362 | 84,920 | 80,300 | 80,553 | 74,627 | 59,589 | 83,816 | 76,885 | 79,122 | 76,269 | 79,811 |
| 2020 | 79,496 | 74,928 | 81,363 | 74,372 | 58,651 | 56,616 | 61,787 | 37,964 | 43,042 | 32,666 | 54,635 | 61,277 |
| 2021 | 65,342 | 58,638 | 67,675 | 63,398 | 65,480 | 61,087 | 65,136 | 54,779 | 28,094 | 53,256 | 58,931 | 61,120 |
| 2022 | 58,221 | 51,181 | 58,187 | 59,430 | 55,725 | 58,110 | 59,972 | 61,737 | 58,383 | 59,771 | 58,105 | 58,025 |
| 2023 | 62,804 | 54,866 | 58,928 | 53,480 | 50,947 | 51,393 | 54,329 | 54,659 | 55,588 | 53,748 | 51,473 | 54,073 |
| 2024 | 53,153 | 48,975 | 48,262 | 50,821 | 47,540 | 49,107 | 52,298 | 52,842 | 41,490 | 52,104 | 43,963 | 52,306 |
| - = No Data Reported; -- = Not Applicable; NA = Not Available; W = Withheld to avoid disclosure of individual company data. |
| Release Date: 6/30/2026 |
| Next Release Date: 7/31/2026 |