|
Download Data (XLS File) |
|
||||||||
|
||||||||
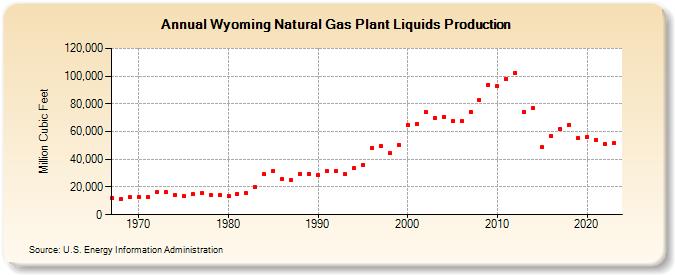
| Wyoming Natural Gas Plant Liquids Production (Million Cubic Feet) | ||||||||
| Decade | Year-0 | Year-1 | Year-2 | Year-3 | Year-4 | Year-5 | Year-6 | Year-7 | Year-8 | Year-9 |
|---|---|---|---|---|---|---|---|---|---|---|
| 1960's | 11,993 | 11,390 | 12,540 | |||||||
| 1970's | 12,863 | 12,802 | 16,228 | 16,093 | 14,072 | 13,224 | 14,669 | 15,625 | 14,363 | 14,056 |
| 1980's | 13,582 | 15,160 | 15,482 | 19,668 | 29,169 | 31,871 | 25,819 | 24,827 | 29,434 | 29,247 |
| 1990's | 28,591 | 31,470 | 31,378 | 29,118 | 33,486 | 36,058 | 48,254 | 49,333 | 44,358 | 50,639 |
| 2000's | 65,085 | 65,740 | 74,387 | 69,817 | 70,831 | 67,563 | 67,435 | 74,234 | 82,922 | 93,796 |
| 2010's | 92,777 | 97,588 | 102,549 | 74,409 | 76,943 | 48,552 | 56,625 | 61,748 | 65,003 | 55,048 |
| 2020's | 56,332 | 53,711 | 51,109 | 51,573 | 54,203 |
| - = No Data Reported; -- = Not Applicable; NA = Not Available; W = Withheld to avoid disclosure of individual company data. |
| Release Date: 6/30/2026 |
| Next Release Date: 7/31/2026 |