|
Download Data (XLS File) |
|
||||||||
|
||||||||
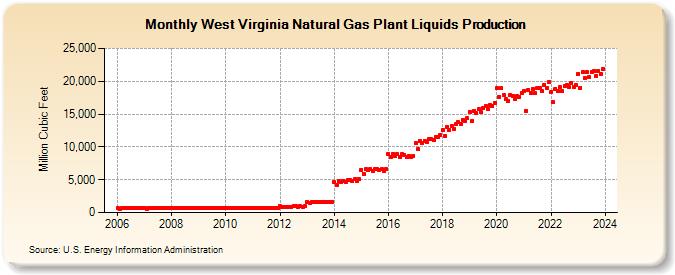
| West Virginia Natural Gas Plant Liquids Production (Million Cubic Feet) | ||||||||
| Year | Jan | Feb | Mar | Apr | May | Jun | Jul | Aug | Sep | Oct | Nov | Dec |
|---|---|---|---|---|---|---|---|---|---|---|---|---|
| 2006 | 665 | 599 | 674 | 649 | 674 | 667 | 682 | 684 | 668 | 692 | 667 | 696 |
| 2007 | 660 | 605 | 681 | 650 | 688 | 666 | 681 | 684 | 669 | 693 | 684 | 709 |
| 2008 | 702 | 662 | 717 | 692 | 715 | 700 | 736 | 726 | 620 | 697 | 699 | 726 |
| 2009 | 759 | 692 | 761 | 724 | 748 | 727 | 742 | 748 | 704 | 737 | 713 | 732 |
| 2010 | 701 | 647 | 717 | 697 | 725 | 693 | 729 | 738 | 716 | 752 | 728 | 763 |
| 2011 | 701 | 621 | 719 | 704 | 729 | 701 | 730 | 738 | 713 | 760 | 745 | 766 |
| 2012 | 927 | 850 | 912 | 880 | 914 | 878 | 931 | 927 | 902 | 934 | 905 | 927 |
| 2013 | 1,635 | 1,481 | 1,635 | 1,603 | 1,651 | 1,595 | 1,681 | 1,677 | 1,619 | 1,678 | 1,641 | 1,667 |
| 2014 | 4,604 | 4,257 | 4,748 | 4,707 | 4,837 | 4,706 | 4,966 | 4,993 | 4,830 | 5,041 | 4,847 | 5,047 |
| 2015 | 6,523 | 5,921 | 6,584 | 6,464 | 6,583 | 6,356 | 6,588 | 6,596 | 6,423 | 6,589 | 6,350 | 6,562 |
| 2016 | 8,940 | 8,481 | 8,964 | 8,669 | 8,856 | 8,488 | 8,843 | 8,773 | 8,433 | 8,680 | 8,470 | 8,654 |
| 2017 | 10,529 | 9,643 | 10,918 | 10,579 | 10,931 | 10,681 | 11,151 | 11,145 | 10,974 | 11,541 | 11,517 | 11,830 |
| 2018 | 12,607 | 11,625 | 13,021 | 12,579 | 13,148 | 12,788 | 13,478 | 13,750 | 13,524 | 14,152 | 13,935 | 14,329 |
| 2019 | 15,356 | 13,964 | 15,531 | 15,103 | 15,725 | 15,260 | 15,856 | 16,241 | 15,778 | 16,447 | 16,177 | 16,697 |
| 2020 | 18,906 | 17,666 | 18,919 | 17,827 | 17,325 | 17,005 | 17,883 | 17,826 | 17,269 | 17,709 | 17,666 | 18,282 |
| 2021 | 18,528 | 15,495 | 18,710 | 18,248 | 18,841 | 18,168 | 18,951 | 19,007 | 18,519 | 19,440 | 19,025 | 19,825 |
| 2022 | 18,389 | 16,768 | 18,870 | 18,441 | 19,069 | 18,509 | 19,278 | 19,403 | 19,068 | 19,669 | 19,058 | 19,411 |
| 2023 | 21,195 | 19,068 | 21,414 | 20,551 | 21,413 | 20,481 | 21,326 | 21,455 | 20,805 | 21,521 | 21,145 | 21,879 |
| 2024 | 25,547 | 24,557 | 25,683 | 24,623 | 25,482 | 24,957 | 26,116 | 25,873 | 24,863 | 26,050 | 25,214 | 26,530 |
| - = No Data Reported; -- = Not Applicable; NA = Not Available; W = Withheld to avoid disclosure of individual company data. |
| Release Date: 6/30/2026 |
| Next Release Date: 7/31/2026 |