|
Download Data (XLS File) |
|
||||||||
|
||||||||
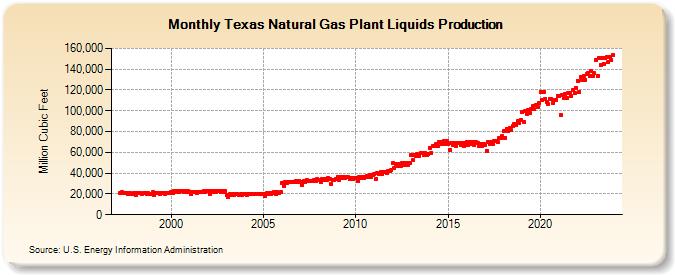
| Texas Natural Gas Plant Liquids Production (Million Cubic Feet) | ||||||||
| Year | Jan | Feb | Mar | Apr | May | Jun | Jul | Aug | Sep | Oct | Nov | Dec |
|---|---|---|---|---|---|---|---|---|---|---|---|---|
| 1997 | 21,158 | 21,556 | 20,550 | 21,157 | 21,124 | 20,354 | 20,907 | 20,279 | 20,214 | |||
| 1998 | 20,998 | 19,201 | 21,034 | 20,550 | 20,969 | 20,280 | 20,852 | 21,139 | 20,116 | 20,676 | 19,925 | 19,846 |
| 1999 | 21,397 | 19,419 | 21,083 | 20,451 | 20,905 | 20,262 | 20,854 | 20,729 | 20,262 | 21,123 | 20,619 | 21,121 |
| 2000 | 22,178 | 20,572 | 22,370 | 21,627 | 22,488 | 22,046 | 22,488 | 22,623 | 21,798 | 22,550 | 22,067 | 22,778 |
| 2001 | 22,302 | 20,005 | 22,121 | 21,606 | 22,251 | 20,962 | 22,251 | 22,276 | 21,561 | 22,625 | 21,711 | 22,338 |
| 2002 | 22,496 | 19,986 | 22,503 | 21,811 | 22,764 | 22,232 | 22,811 | 22,798 | 21,516 | 22,896 | 22,265 | 22,714 |
| 2003 | 18,788 | 17,171 | 19,537 | 18,695 | 19,561 | 19,043 | 19,665 | 19,814 | 19,127 | 19,728 | 19,000 | 19,786 |
| 2004 | 20,055 | 18,739 | 20,092 | 19,562 | 20,305 | 19,809 | 20,283 | 20,123 | 19,530 | 20,325 | 19,589 | 20,123 |
| 2005 | 20,051 | 18,397 | 20,613 | 20,158 | 20,739 | 20,186 | 20,711 | 21,644 | 19,698 | 21,473 | 21,075 | 21,634 |
| 2006 | 30,988 | 27,910 | 31,380 | 30,210 | 31,395 | 31,047 | 31,744 | 31,854 | 31,112 | 32,226 | 31,071 | 32,413 |
| 2007 | 31,693 | 29,027 | 32,664 | 31,198 | 33,037 | 31,961 | 32,667 | 32,850 | 32,120 | 33,245 | 32,841 | 34,047 |
| 2008 | 33,575 | 31,685 | 34,309 | 33,095 | 34,192 | 33,490 | 35,235 | 34,734 | 29,649 | 33,362 | 33,432 | 34,745 |
| 2009 | 36,639 | 33,396 | 36,729 | 34,930 | 36,107 | 35,102 | 35,803 | 36,087 | 33,965 | 35,551 | 34,426 | 35,307 |
| 2010 | 35,341 | 32,604 | 36,123 | 35,131 | 36,548 | 34,921 | 36,734 | 37,159 | 36,055 | 37,897 | 36,668 | 38,441 |
| 2011 | 39,102 | 34,620 | 40,096 | 39,264 | 40,663 | 39,136 | 40,705 | 41,182 | 39,791 | 42,426 | 41,573 | 42,750 |
| 2012 | 49,333 | 45,248 | 48,554 | 46,854 | 48,615 | 46,748 | 49,555 | 49,311 | 47,994 | 49,701 | 48,167 | 49,331 |
| 2013 | 57,658 | 52,230 | 57,671 | 56,531 | 58,216 | 56,255 | 59,278 | 59,150 | 57,093 | 59,175 | 57,853 | 58,778 |
| 2014 | 64,513 | 59,650 | 66,519 | 65,948 | 67,778 | 65,930 | 69,577 | 69,955 | 67,675 | 70,624 | 67,909 | 70,716 |
| 2015 | 68,149 | 61,860 | 68,790 | 67,532 | 68,778 | 66,405 | 68,836 | 68,914 | 67,112 | 68,844 | 66,343 | 68,559 |
| 2016 | 70,233 | 66,633 | 70,423 | 68,104 | 69,573 | 66,683 | 69,470 | 68,919 | 66,254 | 68,194 | 66,545 | 67,989 |
| 2017 | 67,339 | 61,673 | 69,825 | 67,655 | 69,909 | 68,310 | 71,315 | 71,275 | 70,182 | 73,810 | 73,652 | 75,656 |
| 2018 | 80,254 | 74,002 | 82,887 | 80,077 | 83,698 | 81,408 | 85,797 | 87,527 | 86,093 | 90,091 | 88,707 | 91,215 |
| 2019 | 98,600 | 89,665 | 99,726 | 96,976 | 100,973 | 97,986 | 101,810 | 104,286 | 101,308 | 105,604 | 103,873 | 107,215 |
| 2020 | 117,956 | 110,218 | 118,032 | 111,223 | 108,091 | 106,096 | 111,573 | 111,213 | 107,742 | 110,484 | 110,214 | 114,061 |
| 2021 | 114,164 | 95,477 | 115,285 | 112,440 | 116,095 | 111,947 | 116,772 | 117,118 | 114,109 | 119,785 | 117,229 | 122,158 |
| 2022 | 129,069 | 117,694 | 132,442 | 129,431 | 133,838 | 129,907 | 135,308 | 136,186 | 133,836 | 138,052 | 133,766 | 136,240 |
| 2023 | 149,251 | 134,275 | 150,793 | 144,719 | 150,789 | 144,227 | 150,171 | 151,084 | 146,507 | 151,547 | 148,898 | 154,071 |
| 2024 | 164,364 | 157,996 | 165,244 | 158,418 | 163,951 | 160,569 | 168,028 | 166,464 | 159,965 | 167,601 | 162,220 | 170,689 |
| - = No Data Reported; -- = Not Applicable; NA = Not Available; W = Withheld to avoid disclosure of individual company data. |
| Release Date: 5/29/2026 |
| Next Release Date: 6/30/2026 |